Annexin V-FITC Apoptosis Detection: Principle, Protocol, and Troubleshooting for Cancer Research
This article provides a comprehensive guide to the Annexin V-FITC assay, a cornerstone technique for detecting early apoptosis in biomedical research.
Annexin V-FITC Apoptosis Detection: Principle, Protocol, and Troubleshooting for Cancer Research
Abstract
This article provides a comprehensive guide to the Annexin V-FITC assay, a cornerstone technique for detecting early apoptosis in biomedical research. Tailored for researchers and drug development professionals, it covers the foundational principle of phosphatidylserine externalization, detailed flow cytometry protocols, common troubleshooting scenarios, and a comparative analysis with other cell death detection methods. The content synthesizes current methodologies and emerging trends, offering a complete resource for the accurate assessment of compound efficacy and safety in preclinical studies.
The Science of Early Apoptosis: Unraveling the Annexin V-FITC Principle
Apoptosis, or programmed cell death, is a fundamental biological process critical for maintaining tissue homeostasis, enabling proper development, and regulating immune responses [1]. This genetically encoded suicide program allows for the precise and controlled elimination of damaged, infected, or unnecessary cells without triggering inflammatory responses that characterize accidental cell death (necrosis). The sophisticated molecular machinery governing apoptosis has become a central focus in biomedical research, particularly because its dysregulation underpins the pathophysiology of numerous diseases, including cancer, neurodegenerative disorders, and autoimmune conditions [2] [3]. When aged or damaged cells fail to undergo proper elimination through apoptosis, it can directly lead to diseases such as cancer, cardiovascular disorders, and dementia [4]. Consequently, accurately detecting and quantifying apoptosis has become an indispensable tool in life sciences and medicine, playing crucial roles in early disease diagnosis, therapeutic development, and evaluation of treatment efficacy.
The significance of apoptosis extends beyond basic biological research into practical clinical applications. The growing burden of chronic diseases in North America and globally has intensified the demand for sophisticated cell-based research tools. In 2022 alone, North America reported 2,673,174 new cancer cases, according to the Global Cancer Observatory, highlighting the urgent need for greater understanding of apoptotic processes in both cancer initiation and response to treatment [2]. The North American apoptosis assay market, valued at USD 2.7 billion in 2024 and projected to reach USD 6.1 billion by 2034, reflects this critical importance in both basic and translational research [2].
Molecular Mechanisms of Apoptosis
The execution of apoptosis occurs through two principal signaling pathways—the extrinsic (death receptor) pathway and the intrinsic (mitochondrial) pathway—that converge on a common execution phase mediated by caspase activation.
The Extrinsic Pathway
The extrinsic pathway initiates apoptosis in response to extracellular signals binding to death receptors on the cell surface. When ligands such as FasL bind to their cognate death receptors, they trigger receptor clustering and formation of the Death-Inducing Signaling Complex (DISC). This complex recruits and activates initiator caspase-8, which then propagates the death signal by activating downstream effector caspases.
The Intrinsic Pathway
The intrinsic pathway activates in response to internal cellular stressors, including DNA damage, oxidative stress, and growth factor withdrawal. These stimuli cause mitochondrial outer membrane permeabilization, leading to the release of cytochrome c into the cytosol. Cytochrome c then forms a complex with Apaf-1 and caspase-9 known as the apoptosome, which activates the caspase cascade.
Execution Phase
Both pathways converge on the activation of executioner caspases, particularly caspase-3 and caspase-7, which orchestrate the systematic dismantling of the cell by cleaving hundreds of cellular substrates. Caspase-3 serves as the "final executioner" of apoptosis, selectively cleaving proteins at specific amino acid sequences [4]. One critical outcome of caspase activation is the translocation of phosphatidylserine from the inner to the outer leaflet of the plasma membrane, which serves as a fundamental "eat-me" signal for phagocytic cells [5] [1].
Diagram 1: Apoptosis Signaling Pathways. This diagram illustrates the extrinsic (death receptor) and intrinsic (mitochondrial) pathways of apoptosis that converge on the activation of executioner caspases, particularly caspase-3, leading to the characteristic biochemical and morphological changes of programmed cell death.
Phosphatidylserine Externalization: The Annexin V Binding Principle
During early apoptosis, a fundamental membrane alteration occurs that serves as a specific marker for identifying apoptotic cells. Phosphatidylserine, a membrane phospholipid normally confined to the inner leaflet of the plasma membrane in viable cells, rapidly translocates to the outer leaflet during the early stages of apoptosis [1] [6]. This loss of membrane asymmetry represents one of the earliest detectable events in the apoptotic process, occurring before the loss of membrane integrity [6].
Annexin V is a 35-36 kDa cellular protein that belongs to the annexin family of phospholipid-binding proteins, all of which share the characteristic of Ca²⁺-dependent binding to negatively charged phospholipid surfaces [7] [6]. Annexin V demonstrates particularly high affinity, specificity, and sensitivity for phosphatidylserine, making it an ideal probe for detecting this apoptosis-specific membrane alteration [7]. In the presence of Ca²⁺ ions, annexin V binds strongly to exposed phosphatidylserine residues on the surface of apoptotic cells [8]. By conjugating annexin V to fluorochromes such as FITC (fluorescein isothiocyanate), researchers can detect and quantify apoptotic cells using flow cytometry or fluorescence microscopy [1] [6].
The critical importance of this binding event extends beyond laboratory detection—the externalized phosphatidylserine serves as a trigger for the recognition and engulfment of apoptotic cells by phagocytes, thereby promoting the clean and efficient clearance of dying cells and preventing membrane rupture, release of cytoplasmic contents, and further tissue damage [6].
Annexin V-FITC/Propidium Iodide Apoptosis Detection Assay
Principles of Dual Staining
The Annexin V-FITC/propidium iodide (PI) assay represents one of the most widely used and reliable methods for detecting apoptosis in cell populations. This dual-staining approach enables researchers to distinguish between viable, early apoptotic, and late apoptotic/necrotic cells based on their differential staining patterns [5] [1]. The assay works on the principle that normal living cells and early apoptotic cells maintain membrane integrity, which excludes propidium iodide, a DNA-binding dye that cannot penetrate intact cell membranes [9]. In contrast, late apoptotic and necrotic cells have compromised membrane integrity, allowing PI to enter and stain the nucleus [5].
The discrimination of cell populations follows these clear patterns:
- Viable cells are negative for both Annexin V-FITC and PI (Annexin V-/PI-), indicating intact membranes with no phosphatidylserine externalization.
- Early apoptotic cells are positive for Annexin V-FITC but negative for PI (Annexin V+/PI-), demonstrating phosphatidylserine externalization while maintaining membrane integrity.
- Late apoptotic/necrotic cells are positive for both Annexin V-FITC and PI (Annexin V+/PI+), showing both phosphatidylserine externalization and loss of membrane integrity [5] [1] [9].
Experimental Workflow
The Annexin V-FITC/PI apoptosis detection assay follows a standardized protocol that can be adapted for both suspension and adherent cell cultures. The comprehensive workflow, synthesized from multiple established protocols [5] [1] [9], is visualized below:
Diagram 2: Annexin V-FITC/PI Assay Workflow. This diagram outlines the key procedural steps for detecting apoptosis using the Annexin V-FITC/propidium iodide dual-staining method, from cell preparation to final analysis and interpretation of results.
Detailed Protocol for Flow Cytometry
The following step-by-step protocol provides a comprehensive methodology for apoptosis detection using Annexin V-FITC and propidium iodide, compiled from established technical resources [5] [1] [9]:
Cell Preparation and Induction of Apoptosis
- Seed cells at an appropriate density (typically 1 × 10⁶ cells for a T25 culture flask) in triplicate for experimental conditions and prepare additional flasks for controls [5].
- Induce apoptosis using the desired method (e.g., chemical inducers, radiation, drug treatment) and incubate for an appropriate duration (often 48 hours).
- For adherent cells, collect both the supernatant (containing floating apoptotic cells) and trypsinize the adherent cells, then combine respective floating and trypsinized cells [5].
Cell Staining Procedure
- Wash the collected cells twice with PBS and centrifuge (670 × g, 5 minutes, room temperature) [5].
- Resuspend each cell pellet (approximately 1-5 × 10⁵ cells) in 400-500 µL of 1X Annexin V binding buffer [5] [1].
- Add 5 µL of Annexin V-FITC and 5 µL of propidium iodide (PI) staining solution to the cell suspension [1] [9].
- Incubate at room temperature for 5-10 minutes in the dark to prevent fluorochrome photobleaching [1].
Controls Setup
- Unstained control: Cells without any stain (400 µL of cells + 100 µL of incubation buffer) [5].
- Annexin V-only control: Cells stained with Annexin V-FITC only (400 µL of cells + 100 µL of incubation buffer with 2 µL of Annexin) to set compensation and gating [5].
- PI-only control: Cells stained with PI only (400 µL of cells + 100 µL of incubation buffer with 2 µL of propidium iodide) for fluorescence compensation [5].
Flow Cytometry Analysis
- Analyze the cells immediately without washing to prevent loss of weakly attached apoptotic cells [5].
- Use excitation at 488 nm with emission detection using FITC signal detector (usually FL1) for Annexin V-FITC and phycoerythrin emission signal detector (usually FL2) for PI [1].
- Acquire a sufficient number of events (typically 10,000-20,000 cells per sample) for statistically robust analysis.
Research Reagent Solutions
The following table details essential materials and reagents required for performing the Annexin V-FITC/PI apoptosis detection assay, along with their specific functions in the protocol:
Table 1: Essential Research Reagents for Annexin V-FITC Apoptosis Detection
| Reagent/Equipment | Function and Purpose | Specifications and Notes |
|---|---|---|
| Annexin V-FITC conjugate | Binds to externalized phosphatidylserine on apoptotic cells in a Ca²⁺-dependent manner [1] [6] | Typically used at 1 µg/mL concentration; provided in commercial kits or can be produced recombinantly [6] |
| Propidium Iodide (PI) | DNA-binding dye that distinguishes late apoptotic/necrotic cells with compromised membranes [5] [9] | Excluded by intact membranes; penetrates only late apoptotic and necrotic cells [1] |
| Annexin V Binding Buffer | Provides optimal Ca²⁺ concentration and ionic strength for specific Annexin V-PS binding [1] | Typically contains HEPES, NaCl, and CaCl₂ at physiological pH; critical for assay performance |
| Flow Cytometer | Enables quantitative analysis of cell populations based on fluorescence signals [5] [1] | Requires FITC (FL1) and PI (FL2) detection capabilities; proper compensation is essential |
| Centrifuge | Facilitates cell washing and processing steps [5] | Standard laboratory centrifuge capable of 670 × g |
| Cell Culture Vessels | Provides appropriate surface for cell growth and treatment [5] | T25 flasks or other appropriate cultureware |
Data Interpretation and Analysis
Proper interpretation of Annexin V-FITC/PI data requires understanding the distinct cell populations revealed by flow cytometric analysis. The following dot plot illustrates the typical quadrant distribution of cell populations:
Diagram 3: Flow Cytometry Data Interpretation. This diagram represents the typical quadrant analysis of Annexin V-FITC/PI staining, showing the distinct populations of viable (Q3), early apoptotic (Q4), late apoptotic/necrotic (Q2), and necrotic cells (Q1) based on their fluorescence patterns.
Quantitative Analysis of Apoptotic Populations
The following table provides representative data from apoptosis studies, demonstrating how different treatments affect the distribution of cell populations:
Table 2: Quantitative Analysis of Cell Populations in Apoptosis Studies
| Experimental Condition | Viable Cells (Annexin V-/PI-) | Early Apoptotic Cells (Annexin V+/PI-) | Late Apoptotic/Necrotic Cells (Annexin V+/PI+) | Research Context |
|---|---|---|---|---|
| Untreated control cells | 85-95% | 3-8% | 2-5% | Baseline apoptosis in normal culture conditions [5] [1] |
| Dihydroartemisinin-treated A549 | 40-60% | 25-40% | 10-20% | Non-small cell lung cancer cell line response to treatment [8] |
| Dexamethasone-induced thymocytes | 30-50% | 30-45% | 15-25% | Model of immune cell apoptosis [10] |
| H₂O₂-induced K562 cells | 20-40% | 35-50% | 20-30% | Oxidative stress-induced apoptosis [10] |
Comparison with Other Apoptosis Detection Methods
While the Annexin V-FITC/PI assay is widely used for early apoptosis detection, several other methods provide complementary information about cell death processes. The table below compares the key characteristics of major apoptosis detection techniques:
Table 3: Comparison of Apoptosis Detection Methods
| Method | Detection Principle | Stage of Apoptosis Detected | Advantages | Limitations |
|---|---|---|---|---|
| Annexin V-FITC/PI staining | Phosphatidylserine externalization and membrane integrity [1] | Early and late apoptosis | Rapid, live-cell analysis, quantitative, distinguishes apoptosis stages [1] | Cannot distinguish apoptosis from other PS-exposing cell death (e.g., necroptosis) [1] |
| TUNEL assay | DNA fragmentation from internucleosomal cleavage [1] | Late apoptosis | Specific for apoptotic DNA cleavage, can be used on tissue sections | End-point assay, requires cell fixation, more complex workflow [1] |
| Caspase activity assays | Caspase enzyme activity measurement [1] | Early to mid apoptosis | Provides mechanistic insight into apoptotic pathways | Requires cell lysis, endpoint assay, does not assess membrane changes [1] |
| Hoechst 33342/PI staining | Nuclear chromatin condensation and membrane integrity [10] | Mid to late apoptosis | Can reveal morphological nuclear changes | Less specific for early apoptosis compared to Annexin V [10] |
| Novel fluorescent reporters | Caspase-3 cleavage of engineered GFP [4] | Mid apoptosis (caspase activation) | Real-time monitoring in living cells, high sensitivity | New technology, limited adoption, requires genetic manipulation [4] |
Applications in Biomedical Research and Drug Development
The Annexin V-FITC apoptosis detection assay serves as a critical tool across multiple domains of biomedical research and therapeutic development:
Oncology and Cancer Therapeutics
In cancer research, the Annexin V-FITC assay is extensively used to evaluate the efficacy of chemotherapeutic agents, targeted therapies, and novel compounds in inducing apoptosis in cancer cells [8] [1]. The ability to distinguish early apoptotic cells enables researchers to quantify treatment responses and determine optimal dosing regimens. For instance, the assay has been successfully employed to demonstrate the apoptotic effects of dihydroartemisinin on non-small cell lung cancer A549 cells [8]. The growing emphasis on personalized cancer therapies has further increased the importance of apoptosis assays, as they allow clinicians and researchers to assess whether tumor cells are responding to drug candidates by undergoing apoptosis, thereby informing dose planning and treatment response prediction [2].
Neurodegenerative Disease Research
In neurodegenerative conditions such as Alzheimer's and Parkinson's disease, excessive apoptosis contributes to neuronal loss [2] [3]. The Annexin V-FITC assay provides a valuable tool for investigating mechanisms of neuronal cell death and screening potential neuroprotective compounds. The aging global population, particularly in North America where the number of people aged 65 and older is projected to grow from 58 million in 2022 to 82 million by 2050, underscores the increasing importance of understanding and modulating apoptotic processes in age-related neurological disorders [2].
Drug Discovery and Toxicology
Pharmaceutical companies routinely incorporate apoptosis assays into their drug discovery pipelines for both efficacy testing and safety assessment [2] [3]. The Annexin V-FITC assay is used in high-throughput screening platforms to identify novel compounds that induce apoptosis in target cells, as well as to evaluate drug-induced cytotoxicity in normal cells for toxicological profiling. The apoptosis testing market is projected to grow at a CAGR of 5.2%, increasing from USD 3,524 Million in 2025 to approximately USD 5,850.6 Million by 2035, reflecting the expanding application of these assays in pharmaceutical R&D [3].
Immunology and Autoimmune Diseases
Apoptosis plays a crucial role in immune system regulation, particularly in the elimination of self-reactive lymphocytes and the termination of immune responses. Dysregulation of apoptotic processes can lead to autoimmune disorders and immunodeficiency [1]. The Annexin V-FITC assay is used to study activation-induced cell death in T-cells and to investigate apoptotic defects in autoimmune conditions such as lupus and rheumatoid arthritis.
Market Landscape and Future Perspectives
The apoptosis assay market, particularly in North America, demonstrates robust growth driven by technological advancements, increasing chronic disease prevalence, and expanding applications in drug development. The market is characterized by several key trends and future directions:
Market Size and Growth Projections
The North America apoptosis assay market was valued at USD 2.7 billion in 2024 and is projected to grow from USD 3 billion in 2025 to USD 6.1 billion by 2034, expanding at a compound annual growth rate (CAGR) of 8.4% [2]. This growth trajectory significantly outpaces the global apoptosis testing market, which is projected to grow at a CAGR of 5.2% from 2025 to 2035 [3]. The consumables segment, which includes reagents, assay kits, buffers, and microplates, dominates the product landscape with a market value of USD 1.5 billion in 2024 and is projected to reach USD 3.4 billion by 2034 [2].
Technological Advancements and Future Trends
The field of apoptosis detection is undergoing rapid transformation with several emerging technologies and approaches:
- Advanced Screening Technologies: Flow cytometry, fluorescence imaging, and luminescence-based assays are becoming standard tools in research laboratories, allowing scientists to detect early apoptotic signals with improved sensitivity and reliability [2].
- Artificial Intelligence Integration: AI-powered platforms now offer automated gating, real-time image processing, and predictive analytics, significantly improving assay accuracy and laboratory efficiency [2]. These systems are increasingly linked to cloud-based data platforms, enabling remote collaboration and long-term data tracking.
- Novel Reporter Systems: Recent developments include fluorescent reporter technologies that enable real-time visualization of apoptosis inside living cells. For instance, researchers have successfully engineered a biosensor that loses fluorescence when cleaved by caspase-3, allowing for real-time and highly sensitive detection of apoptosis [4].
- 3D Cell Culture and Organ-on-a-Chip Platforms: The integration of apoptosis assays with more physiologically relevant 3D culture systems and organ-on-chip technologies represents a significant advancement for drug screening and disease modeling [2] [3].
The Annexin V-FITC apoptosis detection method remains a cornerstone technology in programmed cell death research, providing researchers with a reliable, sensitive, and quantitative approach for analyzing apoptosis in diverse experimental systems. As the field continues to evolve, integration with emerging technologies such as AI analytics, advanced reporter systems, and complex culture platforms will further enhance our ability to study apoptotic processes in health and disease, ultimately accelerating therapeutic development across multiple disease areas.
The breakdown of plasma membrane asymmetry, characterized by the externalization of phosphatidylserine (PS), is a universal and early hallmark of apoptotic cell death. This physiological event serves as a specific "eat-me" signal for the recognition and clearance of dying cells, playing a crucial role in maintaining tissue homeostasis and eliciting immunomodulatory responses. The discovery that Annexin V, a calcium-dependent phospholipid-binding protein, can specifically recognize exposed PS has revolutionized apoptosis detection, providing researchers with a sensitive tool for identifying early apoptotic stages before the loss of membrane integrity. This technical review examines the molecular mechanisms underlying PS externalization, details standardized methodologies for its detection, and explores the significance of this event within the broader context of apoptotic signaling pathways and their implications for biomedical research and therapeutic development.
Physiological Membrane Organization
In viable eukaryotic cells, the plasma membrane maintains strict phospholipid asymmetry between its two leaflets. The inner cytoplasmic leaflet is enriched with phosphatidylserine (PS) and phosphatidylethanolamine (PE), while the outer leaflet predominantly contains phosphatidylcholine (PC) and sphingomyelin [11]. This organization creates an electrostatic charge distribution essential for proper membrane protein assembly and intracellular signaling [11]. Maintenance of this asymmetry is an active process mediated by specific lipid-translocating proteins, including ATP-dependent flippases that transport PS and PE inward, and floppases that move specific lipids outward [11].
Apoptosis as a Programmed Cell Death Pathway
Apoptosis represents a genetically programmed cell death mechanism essential for development, immune regulation, and tissue homeostasis [1]. Unlike necrotic cell death which results from acute injury and triggers inflammatory responses, apoptosis occurs through a highly orchestrated dismantling of cellular structures while maintaining plasma membrane integrity until late stages [12]. This controlled process prevents the release of intracellular contents that could elicit inflammatory responses, instead promoting silent phagocytic clearance of cellular corpses.
Molecular Mechanisms of Phosphatidylserine Externalization
Execution of Membrane Asymmetry Collapse
During early apoptosis, the characteristic phospholipid asymmetry disintegrates through caspase-dependent mechanisms that target lipid-translocating machinery [13]. This process involves two coordinated events:
- Inactivation of flippases: Caspase-mediated cleavage of ATP11C and its chaperone CDC50A disrupts ATP-dependent transport of PS from the outer to inner leaflet [13].
- Activation of scramblases: Caspases activate XKR8 phospholipid scramblase, facilitating bidirectional translocation of phospholipids between membrane leaflets and randomizing phospholipid distribution [13].
The consequence is a rapid, caspase-dependent redistribution of PS to the outer membrane leaflet, typically occurring within 5-10 minutes after apoptotic stimulation [11].
PS Externalization as an Apoptotic "Eat-Me" Signal
Exposed PS serves as a universal recognition signal for phagocytic cells, enabling efficient clearance of apoptotic corpses before membrane integrity is compromised [11]. This "eat-me" signal is recognized by multiple receptors on phagocytes, including those of the Tyro3/Axl/Mer (TAM) family of receptor tyrosine kinases [13]. The exposure of PS on the cell surface represents an evolutionarily conserved mechanism for apoptotic cell removal that operates across cell types and species barriers [11].
Table 1: Key Proteins Involved in Phosphatidylserine Externalization During Apoptosis
| Protein | Function | Regulation in Apoptosis | Biological Role |
|---|---|---|---|
| ATP11C/CDC50A | Flippase complex | Caspase-mediated inactivation | Maintains PS internalization in viable cells |
| XKR8 | Phospholipid scramblase | Caspase-dependent activation | Promotes bidirectional PS translocation |
| Annexin V | PS-binding protein | Calcium-dependent binding | Detection reagent for exposed PS |
| TAM receptors | Phagocyte recognition | Bind exposed PS on apoptotic cells | Mediates apoptotic cell clearance |
Relationship to Other Apoptotic Events
PS externalization represents an early apoptotic event that typically precedes characteristic morphological changes such as nuclear condensation, DNA fragmentation, and loss of mitochondrial membrane potential [11]. While correlated with caspase activation, PS exposure can occur in certain caspase-independent death pathways and has been observed in enucleated cells, indicating that the scramblase activation machinery operates independently of nuclear events [11].
Annexin V Binding Principle for Apoptosis Detection
Biochemical Basis of Annexin V-PS Interaction
Annexin V is a 35-36 kDa vascular protein that binds with high affinity to PS in a calcium-dependent manner [14] [15]. The protein demonstrates remarkable specificity for PS, binding approximately 50 PS monomers per protein molecule with a stoichiometry that enables sensitive detection of even minimal PS externalization [16] [17]. This binding occurs without penetrating the intact plasma membrane of viable cells, making it an ideal probe for detecting early apoptotic events [18].
Development as an Apoptosis Detection Tool
The application of Annexin V for apoptosis detection was pioneered in 1995 when researchers demonstrated that fluorescein-labeled Annexin V could identify apoptotic cells by flow cytometry [14]. This groundbreaking work established that Annexin V binding, when combined with a viability dye such as propidium iodide (PI), could discriminate between intact (Annexin V-/PI-), apoptotic (Annexin V+/PI-), and necrotic (Annexin V+/PI+) cell populations [14]. The assay has since become the gold standard for early apoptosis detection, outperforming methods based on viability dyes or caspase activation in both sensitivity and temporal resolution [12].
Diagram 1: PS Externalization and Detection in Apoptosis
Experimental Methodologies and Protocols
Standard Annexin V-FITC/Propidium Iodide Staining Protocol
The following protocol provides a standardized methodology for detecting apoptosis using Annexin V-FITC conjugate and propidium iodide (PI), adapted from established commercial protocols and research methodologies [1] [19].
Reagents and Equipment
- Annexin V-FITC conjugate
- Propidium iodide (PI) staining solution
- 1X Annexin V binding buffer (10 mM HEPES/NaOH pH 7.4, 140 mM NaCl, 2.5 mM CaCl₂)
- Ice-cold phosphate-buffered saline (PBS)
- Flow cytometer with capability for FITC (FL1) and PI (FL2) detection
- Centrifuge capable of 300 × g
- Microscope (for adherent cell validation)
Staining Procedure for Suspension Cells
- Cell Preparation: Harvest 1-5 × 10⁵ cells by gentle centrifugation at 300 × g for 5 minutes. Wash cells twice with ice-cold PBS.
- Resuspension: Resuspend cell pellet in 195 μL of 1X Annexin V binding buffer.
- Staining: Add 5 μL of Annexin V-FITC conjugate. Optionally add 5 μL of PI for simultaneous viability assessment.
- Incubation: Incubate at room temperature for 10-15 minutes in the dark.
- Analysis: Analyze by flow cytometry within 1 hour of staining.
Staining Procedure for Adherent Cells
- Cell Preparation: Gently trypsinize adherent cells and neutralize trypsin with serum-containing media.
- Washing: Wash cells twice with ice-cold PBS by centrifugation at 300 × g for 5 minutes.
- Staining: Follow steps 2-5 as for suspension cells.
Table 2: Interpretation of Annexin V-FITC/PI Dual Staining Results
| Cell Population | Annexin V-FITC | Propidium Iodide | Physiological State |
|---|---|---|---|
| Viable | Negative | Negative | Healthy, non-apoptotic |
| Early Apoptotic | Positive | Negative | Early apoptosis, membrane intact |
| Late Apoptotic | Positive | Positive | Late apoptosis, membrane compromised |
| Necrotic | Positive/Negative | Positive | Primary necrosis, membrane disrupted |
Critical Experimental Considerations
Optimization Parameters
- Calcium concentration: Maintain 2.5 mM CaCl₂ in binding buffer for optimal Annexin V-PS interaction [18].
- Cell concentration: Use 1-5 × 10⁵ cells per sample for optimal flow cytometry analysis [1].
- Time considerations: Analyze samples immediately after staining as PS externalization is reversible and membrane integrity may deteriorate over time.
- Temperature control: Perform all washing and staining steps on ice or at 4°C to slow biochemical processes.
Common Technical Pitfalls and Solutions
- False positives from necrosis: Include Necrostatin-1, a specific necrosis inhibitor, if necrotic death confounds results [16] [17].
- Trypsin-induced artifacts: For adherent cells, minimize trypsinization time and use serum-containing media for neutralization [1].
- Calcium sensitivity: Ensure calcium-containing buffers are fresh and properly pH-adjusted.
- Fixation considerations: If fixation is required, perform ONLY after Annexin V staining using aldehyde-based fixatives without detergents [18].
Advanced Methodological Adaptations
Real-Time Kinetic Analysis with Live-Cell Imaging
Recent methodological advances enable real-time kinetic analysis of apoptosis using Annexin V conjugates with high-content live-cell imaging systems [12]. This approach offers several advantages over traditional flow cytometry:
- Enhanced sensitivity: Detects apoptosis approximately 10-fold more sensitively than flow cytometry-based methods [12].
- Kinetic resolution: Enables continuous monitoring of apoptotic progression in the same cell population over time.
- Reduced handling artifact: Eliminates mechanical stress associated with sample preparation for flow cytometry.
- Multiplexing capability: Compatible with simultaneous tracking of cell proliferation and viability markers.
The protocol involves incubating cells with non-toxic concentrations of Annexin V conjugates (as low as 0.25 μg/mL) in standard culture media, with imaging performed at regular intervals without disturbing the cells [12].
Alternative Viability Dyes for Multiplexing
While PI remains the most common viability dye for Annexin V assays, alternative dyes offer advantages for specific applications:
- 7-AAD: Longer wavelength emission reduces spectral overlap with FITC.
- DRAQ7: Far-red fluorescent DNA dye compatible with live-cell imaging.
- YOYO3: Superior performance in kinetic assays with faster staining of late apoptotic cells compared to DRAQ7 [12].
Research Reagent Solutions
Table 3: Essential Reagents for Phosphatidylserine Externalization Research
| Reagent/Category | Specific Examples | Function/Application | Technical Notes |
|---|---|---|---|
| Annexin V Conjugates | Annexin V-FITC, Annexin V-594, Annexin V-iFluor | PS binding and detection | Fluorophore choice depends on instrument capabilities and multiplexing needs |
| Viability Probes | Propidium iodide, 7-AAD, DRAQ7, YOYO3 | Membrane integrity assessment | YOYO3 shows superior performance in kinetic live-cell assays [12] |
| Binding Buffers | 1X Annexin V binding buffer | Calcium-dependent PS binding | Standard formulation: 10 mM HEPES, 140 mM NaCl, 2.5 mM CaCl₂, pH 7.4 [18] |
| Apoptosis Inducers | Staurosporine, camptothecin, cycloheximide | Positive controls | Concentrations and timing must be optimized for each cell type |
| Specialized Tools | pSIVA-IANBD | Reversible PS binding | Enables monitoring of PS externalization dynamics [16] |
| Necrosis Inhibitors | Necrostatin-1 | Suppresses necrotic death | Reduces false positive signals from primary necrosis [16] [17] |
Comparative Analysis with Other Apoptosis Detection Methods
Advantages of Annexin V-Based PS Detection
The Annexin V binding assay offers several distinct advantages over alternative apoptosis detection methods:
- Early detection: Identifies apoptosis before loss of membrane integrity, typically preceding DNA fragmentation and morphological changes [1] [11].
- Live cell application: Can be performed on viable cells without fixation, enabling cell sorting for subsequent analysis.
- High-throughput compatibility: Adaptable to flow cytometry and plate-based screening formats.
- Quantitative capability: Provides stoichiometric binding that correlates with PS exposure extent.
- Multiplexing flexibility: Compatible with antibody staining and other fluorescent probes.
Limitations and Complementary Approaches
Despite its utility, the Annexin V assay has specific limitations that may necessitate complementary approaches:
- Necrosis confusion: Cannot distinguish between apoptosis and other forms of PS-exposing cell death, including necroptosis [1].
- Calcium dependence: Binding efficiency is sensitive to calcium concentration fluctuations.
- Pathway ambiguity: Provides no information about upstream apoptotic signaling events or caspase activation [1].
- Cell type variability: Some cell types may externalize PS inefficiently or through alternative mechanisms.
Diagram 2: Temporal Sequence of Apoptotic Events and Detection Methods
Research Applications and Biological Significance
Biomedical Research Applications
The detection of PS externalization through Annexin V binding has become fundamental to multiple research domains:
- Oncology research: Evaluation of chemotherapeutic efficacy and resistance mechanisms [1].
- Immunology studies: Assessment of T-cell activation-induced cell death and immune tolerance [1].
- Neurodegenerative disease research: Analysis of neuronal cell death in Alzheimer's and Parkinson's models.
- Toxicology screening: High-throughput assessment of compound cytotoxicity.
- Developmental biology: Mapping of programmed cell death during embryogenesis.
Immunomodulatory Consequences of PS Exposure
Beyond its role as a phagocytic signal, PS externalization triggers profound immunosuppressive responses in the tissue microenvironment. Recent research demonstrates that PS exposure contributes to what has been termed "innate apoptotic immunity" (IAI) – a dominant immunosuppressive program that overrides proinflammatory signaling [13]. This immunomodulatory function operates through mechanisms that are distinct from phagocytic clearance and may involve direct signaling through TAM family receptors on responding cells [13].
Therapeutic Targeting Opportunities
The specific externalization of PS on apoptotic cells and in the tumor microenvironment presents unique therapeutic opportunities:
- Imaging applications: PS-targeting agents for non-invasive detection of apoptosis in vivo.
- Drug delivery systems: PS-directed liposomes for targeted delivery to apoptotic cells.
- Immunomodulatory therapies: PS-based approaches to suppress undesirable immune responses in autoimmunity or transplantation.
- Cancer therapeutics: Bispecific agents that target PS while engaging immune effector cells.
The breakdown of membrane asymmetry with subsequent externalization of phosphatidylserine represents a critical early event in the apoptotic cascade, serving as both a fundamental biological process and a valuable detection marker for research applications. The development of Annexin V-based detection methodologies has provided researchers with a sensitive, quantitative tool for identifying apoptotic cells at their earliest stages, enabling advances across multiple biomedical disciplines. While the core principles of PS externalization are well-established, emerging research continues to reveal new dimensions of its biological significance, particularly in immunomodulation and therapeutic development. As detection methodologies evolve toward real-time kinetic analysis and improved multiplexing capabilities, the study of membrane dynamics in cell death will continue to yield insights with fundamental biological and clinical implications.
Annexin V, a 35-36 kDa phospholipid-binding protein, has emerged as a critical scientific tool for detecting apoptotic cells through its specific, calcium-dependent interaction with phosphatidylserine (PS). During early apoptosis, cells lose membrane asymmetry and translocate PS from the inner to the outer leaflet of the plasma membrane. This externalized PS serves as a molecular beacon for Annexin V binding, forming the basis of widely utilized apoptosis detection assays. This technical guide explores the molecular mechanisms underlying Annexin V's high affinity for PS, details standardized experimental protocols for apoptosis detection, presents quantitative analyses of binding characteristics, and examines emerging applications in biomedical research and drug development. Framed within the context of Annexin V-FITC principles for apoptosis research, this review provides researchers with comprehensive methodological frameworks and technical insights for studying programmed cell death.
The Molecular Basis of Apoptosis Detection
Apoptosis, or programmed cell death, is a fundamental biological process critical for embryonic development, tissue homeostasis, and immune regulation. A hallmark event in early apoptosis is the loss of plasma membrane phospholipid asymmetry, specifically the translocation of phosphatidylserine (PS) from the inner to the outer leaflet [5]. In normal healthy cells, PS is predominantly located in the inner leaflet of the plasma membrane, but during apoptosis, this distribution is rapidly altered [20]. The molecular machinery responsible for maintaining PS asymmetry is deactivated, while scramblase activity facilitates bidirectional movement of phospholipids across the membrane bilayer.
This externalized PS serves as an "eat-me" signal for phagocytic cells to clear apoptotic cells without inducing inflammation [21]. However, from a detection standpoint, it provides an exquisite target for identifying cells in the early stages of apoptosis, before loss of membrane integrity characterizes later apoptotic and necrotic stages.
Annexin V Structure and Function
Annexin V belongs to a family of phospholipid-binding proteins characterized by their calcium-dependent affinity for anionic phospholipids [21]. The protein structure of Annexin V enables its specific binding function. Structural studies have revealed that a cluster of interfacial basic residues, particularly Arg23, serves as a major determinant for phospholipid binding [22]. This interfacial basic cluster participates in an intermolecular salt bridge that is key for trimer formation on membrane surfaces, synergistically coupling trimerization to membrane phospholipid binding [22].
Beyond its applications in apoptosis detection, extracellular Annexin V is now understood to play significant (patho)physiological roles. By binding to PS-exposing apoptotic cells, Annexin V can inhibit procoagulant and proinflammatory activities of dying cells [21]. This regulatory function highlights the biological significance of the Annexin V-PS interaction beyond its utility as a detection mechanism.
Molecular Mechanism of Annexin V - Phosphatidylserine Interaction
Calcium-Dependent Binding Mechanism
The interaction between Annexin V and phosphatidylserine is strictly calcium-dependent, requiring Ca²⁺ ions as molecular bridges between the protein and phospholipid head groups. The binding mechanism involves several key steps:
Calcium Bridge Formation: Calcium ions form coordination complexes between the carboxyl groups of phosphatidylserine and specific binding domains on Annexin V [21]. This bridging function enables the protein to recognize and adhere to the membrane surface.
Membrane Trimerization: Upon binding to PS-containing membranes in the presence of calcium, Annexin V molecules organize into two-dimensional crystalline arrays [20]. Research demonstrates that Arg23 in the interfacial basic cluster participates in an intermolecular salt bridge that is essential for this trimer formation on membrane surfaces [22].
High-Affinity Binding: The combination of calcium bridging and trimerization creates an exceptionally high-affinity interaction with dissociation constants in the nanomolar range [23]. This strong binding is crucial for the sensitivity of apoptosis detection assays.
Structural Determinants of Binding Specificity
The remarkable specificity of Annexin V for phosphatidylserine derives from precise structural features:
Phosphatidylserine Recognition: Annexin V exhibits higher affinity for phosphatidylserine than for other anionic phospholipids due to complementary charge distributions and spatial compatibility with its binding domains [24].
Interfacial Basic Cluster: A cluster of basic residues (Arg23, Lys27, Arg61, and Arg149) positioned at the membrane-binding interface are critical for phospholipid binding. Mutagenesis studies demonstrate that the R23E mutation causes the most significant reduction in membrane adsorption, highlighting Arg23's pivotal role [22].
Calcium Coordination Sites: Annexin V contains multiple calcium-binding sites that undergo conformational changes upon calcium binding, exposing hydrophobic surfaces that facilitate membrane insertion and trimerization [22].
The structural basis for Annexin V's function explains its utility in apoptosis detection and its natural role in regulating PS-mediated processes during cell death.
Quantitative Analysis of Annexin V-Membrane Interactions
Binding Kinetics and Affinity
Quantitative studies of Annexin V-membrane interactions provide crucial insights for assay optimization and data interpretation. Research utilizing engineered Annexin V-EGFP fusion proteins has enabled precise quantification of binding characteristics under varying conditions [23]. The mathematical relationship between membrane-bound Annexin V (B), calcium concentration ([C]), and protein concentration ([P]) can be described by the following expression:
[ B = \frac{B{max} \times [P]^n \times [C]^m}{Kd + [P]^n \times [C]^m} ]
Where (B{max}) represents maximum binding capacity, (Kd) is the dissociation constant, and (n) and (m) represent cooperativity coefficients for protein and calcium concentration, respectively. Analysis suggests that the binding reaction may involve sequential multiple steps rather than a simple single-step mechanism [23].
Calcium Dependence and Optimization
The calcium dependence of Annexin V binding follows a sigmoidal relationship, with binding increasing sharply above a threshold concentration of approximately 50-100 µM and reaching saturation at 1-2 mM calcium [23] [25]. This profound calcium dependence has critical implications for experimental design:
Buffer Requirements: Assay buffers must contain sufficient calcium concentrations (typically 2.5 mM) to support optimal Annexin V binding [25] [24].
Chelator Interference: The presence of calcium chelators like EDTA or EGTA completely abolishes Annexin V binding, necessitating careful preparation of cell suspensions free of these compounds [25].
Cell Preparation: Trypsinization procedures for adherent cells must include calcium-free washes followed by resuspension in calcium-containing binding buffers to enable specific Annexin V binding [1].
Table 1: Quantitative Parameters of Annexin V-Phosphatidylserine Interaction
| Parameter | Value Range | Experimental Conditions | Significance |
|---|---|---|---|
| Dissociation Constant (Kd) | 1-10 nM | 2.5 mM Ca²⁺, neutral pH | Determines assay sensitivity and reagent concentration requirements |
| Calcium Dependence | 50-100 µM (threshold) 1-2 mM (saturation) | Physiological pH, room temperature | Critical for buffer formulation |
| Binding Cooperativity | n = 1.5-2.5 (for [P]) m = 1.0-2.0 (for [C]) | Varies by cell type and PS density | Suggests multi-step binding mechanism |
| Optimal pH Range | 7.2-7.6 | 2.5 mM Ca²⁺ | Maintains protein structure and calcium binding |
Experimental Protocols for Apoptosis Detection
Standard Flow Cytometry Protocol
The Annexin V binding assay combined with flow cytometry represents the gold standard for quantitative apoptosis detection in heterogeneous cell populations. The following protocol is adapted from established methodologies [5] [25] [24]:
Materials Required
- Annexin V conjugate (FITC, PE, APC, or other fluorochromes)
- Propidium iodide (PI) or 7-Aminoactinomycin D (7-AAD)
- 10X Binding Buffer: 0.1 M HEPES (pH 7.4), 1.4 M NaCl, 25 mM CaCl₂
- Flow cytometry staining buffer
- Round-bottom flow cytometry tubes
Procedure
Cell Preparation: Harvest approximately 1-5 × 10⁵ cells by gentle centrifugation (300 × g for 5 minutes). For adherent cells, use mild trypsinization and neutralize with serum-containing media [1].
Washing: Wash cells twice with cold PBS and once with 1X Binding Buffer (prepared by diluting 10X concentrate with distilled water).
Staining: Resuspend cell pellet in 100 µL of 1X Binding Buffer. Add 5 µL of Annexin V conjugate and incubate for 15 minutes at room temperature protected from light.
Viability Staining: Add 5 µL of propidium iodide (PI) or 7-AAD without washing. Incubate for 5-15 minutes on ice.
Analysis: Add 400 µL of 1X Binding Buffer and analyze by flow cytometry within 1 hour.
Critical Considerations
- Calcium Dependence: Maintain calcium concentrations throughout the procedure; avoid EDTA-containing buffers [25].
- Timing: Analyze samples promptly as PI can become toxic to cells over extended periods [24].
- Controls: Include unstained cells, Annexin V-only, and PI-only controls for compensation and gating [5].
- Membrane Integrity: Avoid fixation before staining as membrane disruption causes nonspecific Annexin V binding to internal PS [1].
Experimental Workflow
The following diagram illustrates the standard experimental workflow for Annexin V-based apoptosis detection:
Data Interpretation and Gating Strategy
Flow cytometric analysis of Annexin V/PI staining enables discrimination of four distinct cell populations:
Viable Cells (Annexin V⁻/PI⁻): These cells display no significant fluorescence in either channel, indicating intact membranes and no PS externalization.
Early Apoptotic Cells (Annexin V⁺/PI⁻): This population shows positive Annexin V staining but excludes PI, demonstrating PS externalization with maintained membrane integrity [5] [1].
Late Apoptotic/Necrotic Cells (Annexin V⁺/PI⁺): These cells display positive staining for both markers, indicating either late-stage apoptosis with loss of membrane integrity or primary necrosis [24].
Damaged Cells (Annexin V⁻/PI⁺): This rare population may represent cells with membrane damage that precedes PS externalization, or technical artifacts from excessive mechanical stress during processing.
Table 2: Research Reagent Solutions for Annexin V Apoptosis Detection
| Reagent | Function | Application Notes | Commercial Examples |
|---|---|---|---|
| Annexin V Conjugates | PS binding and detection | Fluorochrome selection should consider laser compatibility and spectral overlap | FITC, PE, APC, V500 conjugates [25] [24] |
| Viability Dyes | Membrane integrity assessment | Must be added without subsequent washing step | Propidium iodide, 7-AAD [5] [24] |
| Binding Buffer | Maintain calcium-dependent binding | Must contain 2.5 mM Ca²⁺; avoid EDTA contamination | 10X Annexin Binding Buffer [25] [24] |
| Fixable Viability Dyes | Discrimination of intact/damaged cells when fixation is required | Use before Annexin V staining; not compatible with fixation after staining | FVD eFluor 506, 660, 780 [25] |
| Compensation Controls | Flow cytometry compensation | Required for multicolor panels | Unstained, single-stained controls [24] |
Advanced Applications and Research Implications
Annexin V in Cancer Research and Drug Development
The Annexin V binding assay has become an indispensable tool in oncology research and antineoplastic drug development:
Therapeutic Efficacy Assessment: Quantification of apoptosis induction serves as a key pharmacodynamic endpoint for evaluating chemotherapeutic agents and targeted therapies [1].
Tumor Microenvironment Studies: Phosphorylated Annexin A2 (pANXA2), associated with elevated calcium in solid tumors, provides a targeting opportunity for selective tumor imaging and drug delivery [26].
Mechanistic Studies: The Annexin V assay helps elucidate cell death mechanisms engaged by novel therapeutic modalities, including immune-oncology approaches.
Emerging Research Applications
Beyond conventional apoptosis detection, Annexin V-based methodologies are enabling new research frontiers:
Tumor Imaging: Near-infrared conjugated Annexin V variants and targeting peptides like LS301 are being explored for in vivo imaging of tumor apoptosis, enabling non-invasive monitoring of therapeutic response [26].
Phosphatidylserine Trafficking Studies: Evidence suggests that PS exposure during apoptosis reflects bidirectional trafficking of membrane between the cell surface and cytoplasm, rather than simply activation of scramblase activity [27].
Vascular Biology: Annexin V binding to PS-exposing platelets and endothelial cells provides insights into thrombotic mechanisms and vascular inflammation [21] [20].
Methodological Considerations and Troubleshooting
Common Technical Challenges
Several technical challenges can compromise Annexin V assay results:
False Positives: Mechanical damage during cell harvesting, particularly with adherent cells, can cause nonspecific Annexin V binding. Gentle trypsinization and minimal processing are essential [1].
Calcium Chelation: Residual EDTA from cell culture media or washing buffers can inhibit Annexin V binding. Thorough washing with calcium-containing buffers is critical [25].
Delayed Analysis: Prolonged incubation with viability dyes beyond recommended times can artificially increase necrotic populations due to dye toxicity [24].
Fixation Artifacts: Fixation before Annexin V staining permeabilizes membranes, allowing Annexin V access to internal PS and generating false positive signals [1].
Optimization Strategies
Titration Experiments: Each new cell type or Annexin V conjugate lot should be titrated to determine optimal staining concentrations that maximize signal-to-noise ratio.
Time Course Studies: Apoptosis is a dynamic process; single timepoint measurements may miss transient effects. Time course experiments provide more comprehensive understanding.
Multipanel Design: When incorporating Annexin V into multicolor flow cytometry panels, careful fluorochrome selection and compensation are essential to maintain detection sensitivity.
The calcium-dependent bridge between Annexin V and phosphatidylserine represents a fundamental mechanism that has been successfully leveraged for sensitive, specific detection of apoptotic cells. The quantitative understanding of this interaction, coupled with standardized experimental protocols, has established Annexin V-based assays as cornerstone methodologies in cell death research. As applications expand into in vivo imaging and therapeutic targeting, continued refinement of these techniques will further enhance their utility in basic research and drug development. The integration of Annexin V protocols with emerging technologies promises to unlock new dimensions in our understanding of programmed cell death and its manipulation for therapeutic benefit.
Fluorescein isothiocyanate (FITC) stands as one of the most pivotal tools in modern biological detection, revolutionizing our ability to visualize and quantify molecular interactions since its introduction in 1942 [28]. This fluorescent molecule serves as a cornerstone for sensitive detection across diverse applications, from fundamental research to drug development. FITC functions as an amine-reactive probe, featuring an isothiocyanate group (-N=C=S) that forms stable thiourea linkages with primary amine groups on proteins, antibodies, and other amine-containing biomolecules [28] [29]. This stable covalent bonding capability, combined with its exceptional fluorescent properties, makes FITC an indispensable reagent for investigators requiring precise, sensitive detection methods.
The significance of FITC extends beyond its historical longevity to its practical versatility in contemporary research settings. FITC exhibits high absorptivity and excellent fluorescence quantum yield, ensuring that a large proportion of absorbed photons are converted into emitted fluorescence [30] [28]. This high quantum efficiency, coupled with its water solubility, makes FITC exceptionally effective for creating fluorescent bioconjugates that retain the functional properties of the native biomolecule [30] [28]. The widespread adoption of FITC across instrumentation platforms means most laboratory equipment comes standard with a 488 nm laser and corresponding FITC filter setup, facilitating its integration into existing workflows without requiring specialized equipment [31] [32].
Chemical Principles of FITC Conjugation
Core Reaction Mechanism
The conjugation process of FITC to biomolecules follows a precise chemical mechanism centered on the reactivity of its isothiocyanate functional group. This group (-N=C=S) reacts specifically with primary amines, predominantly found on lysine residues and at the N-terminus of proteins [28] [29]. The reaction proceeds through a nucleophilic attack where the primary amine attacks the electrophilic carbon of the isothiocyanate group, resulting in the formation of a stable thiourea bond that covalently links the fluorescein moiety to the target biomolecule [29]. This bond demonstrates reasonable stability under various conditions, though it can be compromised by concentrated ammonia, which may convert thiourea to guanidine [28].
The specificity of this reaction for primary amines provides researchers with a controllable conjugation process. Unlike isocyanates, which are highly susceptible to decomposition, isothiocyanates remain moderately reactive yet stable in water and most solvents, making them practical for laboratory use [28]. The reaction occurs efficiently under mild alkaline conditions (pH 9.0-9.5), which favor the unprotonated form of primary amines while maintaining protein stability [33]. This balance between reactivity and stability allows researchers to precisely control the degree of labeling by modulating reaction time, temperature, and the molar ratio of FITC to target protein.
Optimization Strategies for Effective Conjugation
Successful FITC conjugation requires careful optimization to maximize detection sensitivity while preserving biomolecule function. The degree of labeling (DOL), representing the average number of fluorophores per protein, critically influences performance. For antibodies, the ideal DOL typically falls between 2-10, though the optimal value must be experimentally determined for each specific application [29]. Excessive labeling can lead to self-quenching, nonspecific binding, or protein precipitation, while insufficient labeling results in inadequate signal intensity [28].
Advanced methodologies have been developed to overcome common conjugation challenges. Researchers have implemented tandem affinity purification (TAP) tags at both N- and C-termini of target proteins, significantly reducing precipitation, degradation, and background fluorescence from unreacted FITC [33]. This approach utilizes maltose-binding protein (MBP) at the N-terminus to enhance expression levels, improve solubility, and facilitate proper folding of fusion partners, followed by a C-terminal His6 tag for efficient second-step purification that removes residual contaminants and unreacted FITC [33]. The incorporation of a tobacco etch virus (TEV) protease cleavage-site between the MBP and target protein allows for precise tag removal after purification, yielding a cleanly labeled protein preparation [33].
Table 1: Key Spectral Properties of FITC
| Property | Value | Application Significance |
|---|---|---|
| Excitation Maximum | 490-491 nm [31] [29] | Matches standard 488 nm laser lines |
| Emission Maximum | 516-525 nm [31] [29] | Green fluorescence easily detectable |
| Extinction Coefficient | 73,000 M⁻¹cm⁻¹ [32] [29] | High absorptivity for strong signal |
| Quantum Yield | 0.50-0.93 [30] [32] | High emission efficiency |
| Molecular Weight | 389 Da [32] | Small size minimizes steric hindrance |
| Correction Factor (A280) | 0.254 [29] | Essential for accurate DOL calculation |
FITC Properties and Quantitative Profiling
Photophysical Characteristics
The photophysical properties of FITC establish its fundamental capacity for sensitive detection. With an excitation maximum at 490-491 nm and an emission maximum at 516-525 nm, FITC aligns perfectly with the 488 nm spectral line found in most flow cytometers, fluorescence microscopes, and plate readers [31] [29] [34]. This instrumentation compatibility significantly contributes to its widespread adoption. The relatively high extinction coefficient of 73,000 M⁻¹cm⁻¹ enables strong light absorption, while the quantum yield of approximately 0.50-0.93 (depending on environment) ensures efficient conversion of absorbed photons to emitted fluorescence [30] [32]. These combined properties yield a bright, easily detectable signal that facilitates sensitive detection across multiple experimental platforms.
The fluorescence emission spectrum of FITC is relatively broad, which can present challenges in multiplexed experiments requiring spectral separation [30]. Additionally, the fluorophore exhibits sensitivity to environmental factors, particularly pH, with fluorescence intensity decreasing significantly as pH drops below 7.0 [30] [29]. This pH sensitivity stems from the equilibrium between the fluorescent dianionic form and non-fluorescent monoanionic and cationic forms of the fluorescein core structure [29]. While this characteristic can complicate quantification in environments with variable pH, it can also be exploited for pH-sensing applications, such as measuring pH changes during cellular processes like apoptosis or ion transport [28].
Practical Performance Considerations
Beyond fundamental spectral properties, several practical considerations influence FITC performance in experimental settings. FITC demonstrates a relatively high rate of photobleaching compared to modern alternatives like Alexa Fluor 488, limiting its utility in applications requiring prolonged illumination [30] [32]. Additionally, fluorescence quenching often occurs upon conjugation to biopolymers, potentially reducing signal intensity [30]. The hydrophobic nature of the fluorescein structure can promote protein aggregation or precipitation, particularly at higher labeling ratios [33] [28]. This necessitates careful optimization of the degree of labeling to balance signal intensity with biomolecule stability and function.
Despite these limitations, FITC remains a widely used and valuable detection tool, particularly for cost-sensitive applications or those utilizing established protocols and instrumentation. The extensive historical data on FITC performance across diverse applications provides researchers with robust reference points for experimental design. Furthermore, the commercial availability of FITC conjugates, conjugation kits, and related reagents ensures accessibility for researchers across disciplines and resource settings [32].
FITC Conjugation and Detection Applications
Annexin V-FITC for Apoptosis Detection
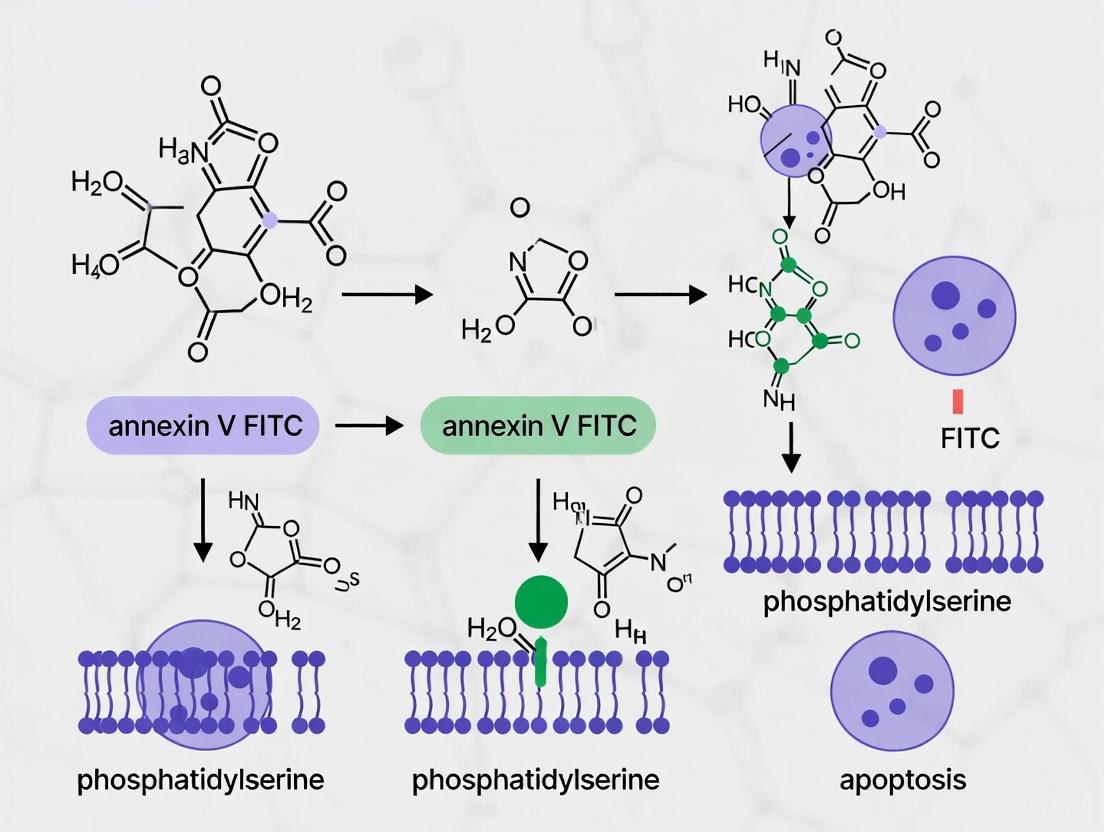
Biochemical Principle of Phosphatidylserine Externalization
The annexin V-FITC assay capitalizes on a fundamental biochemical event in early apoptosis: the translocation of phosphatidylserine (PS) from the inner to the outer leaflet of the plasma membrane [1]. In viable cells, PS remains predominantly restricted to the inner membrane leaflet, but during early apoptosis, this phospholipid redistributes to the external surface while membrane integrity remains intact [35] [1]. Annexin V, a 35-36 kDa human protein, binds with high affinity to PS in a calcium-dependent manner [1]. By conjugating FITC to annexin V, researchers can specifically detect and quantify this externalization event, serving as a sensitive indicator of early apoptotic commitment.
The assay's reliability stems from the specificity of the annexin V-PS interaction and the clear discrimination between apoptotic stages when combined with a viability dye such as propidium iodide (PI) [35] [1]. PI is excluded from cells with intact membranes but penetrates late apoptotic or necrotic cells where membrane integrity has been compromised [1]. This dual-staining approach enables differentiation between viable cells (annexin V-/PI-), early apoptotic cells (annexin V+/PI-), and late apoptotic or necrotic cells (annexin V+/PI+) [1]. This discrimination provides researchers with a nuanced understanding of cell death dynamics in response to experimental treatments.
Experimental Protocol for Annexin V-FITC Staining
The annexin V-FITC apoptosis detection protocol follows a standardized procedure compatible with both suspension and adherent cells [1]. After inducing apoptosis through the desired experimental method, cells are collected and washed to remove external contaminants. For adherent cells, gentle trypsinization is recommended, followed by washing with serum-containing media to neutralize trypsin activity [1]. Cells are then resuspended in a specialized annexin V binding buffer that provides appropriate calcium concentrations and pH for optimal annexin V-PS interaction.
The staining process involves incubating 1-5 × 10⁵ cells in 500 μL of binding buffer with 5 μL of annexin V-FITC for 5 minutes at room temperature in the dark [1]. Propidium iodide (5 μL) can be added simultaneously for dual staining. Following incubation, samples are immediately analyzed by flow cytometry using standard FITC (FL1) and phycoerythrin (FL2) signal detectors, or by fluorescence microscopy with appropriate filter sets [1]. For microscopic analysis, cells can be placed on glass slides with coverslips or briefly fixed with 2% formaldehyde after annexin V-FITC incubation, though fixation must occur after annexin V binding to prevent membrane disruption that could cause non-specific staining [1].
Annexin V-FITC Apoptosis Detection Mechanism
Comparison with Alternative Apoptosis Detection Methods
The annexin V-FITC assay offers distinct advantages over other apoptosis detection methodologies. Compared to TUNEL assays, which detect DNA fragmentation occurring later in apoptosis, annexin V binding identifies apoptosis at an earlier stage [1]. While caspase activity measurements provide mechanistic insight into apoptotic signaling, they require cell lysis and are endpoint assays, whereas annexin V-FITC allows real-time, live-cell analysis [1]. The assay's compatibility with flow cytometry enables high-throughput analysis of large cell populations, making it suitable for drug screening and toxicology studies [1].
Despite its utility, the annexin V-FITC assay has limitations. It cannot definitively distinguish between apoptosis and other forms of programmed cell death involving PS externalization, such as necroptosis [1]. The calcium-dependent binding is reversible, potentially affecting signal stability during extended analysis, and the assay provides no direct information about upstream apoptotic pathway activation [1]. Nevertheless, it remains a gold standard for early apoptosis detection, particularly when combined with complementary assays for comprehensive cell death analysis.
Table 2: Essential Research Reagents for Annexin V-FITC Apoptosis Detection
| Reagent | Function | Application Notes |
|---|---|---|
| Annexin V-FITC conjugate [1] | Binds externalized phosphatidylserine on apoptotic cells | Calcium-dependent binding; optimal at 2-5 μL per 10⁵ cells |
| Propidium iodide (PI) [1] | DNA intercalating dye for detecting membrane integrity | Distinguishes late apoptotic/necrotic cells; use at 5 μL per 10⁵ cells |
| Annexin V binding buffer [1] | Provides optimal calcium concentration and pH for binding | Essential for specific annexin V-PS interaction |
| 2% formaldehyde [1] | Optional fixative for sample preservation | Must be applied after annexin V incubation to prevent artifacts |
| Serum-containing media [1] | Neutralizes trypsin after adherent cell detachment | Preserves membrane integrity for accurate staining |
Advanced Applications and Methodological Innovations
Enhanced Detection Platforms
Recent methodological advances have expanded FITC's utility in apoptosis research through innovative detection platforms. The RealTime-Glo Annexin V Apoptosis and Necrosis Assay represents a significant evolution, utilizing annexin V fusion proteins containing complementary subunits of NanoBiT luciferase rather than FITC [36]. This bioluminescent approach enables continuous, non-lytic monitoring of PS exposure in live cells without requiring washing steps, facilitating real-time kinetic analysis of apoptotic progression [36]. The system incorporates a cell-impermeant profluorescent DNA dye that generates a fluorescent signal upon loss of membrane integrity, allowing simultaneous tracking of PS exposure and membrane permeability in the same well over multiple time points [36].
This real-time methodology provides distinct advantages for drug development applications where understanding the kinetics of cell death is crucial for evaluating therapeutic efficacy and mechanism of action. The platform's non-lytic nature preserves cellular physiology throughout the experiment, and the simple "add-and-read" protocol reduces hands-on time while generating comprehensive temporal data from a single assay plate [36]. The results demonstrate consistency with traditional fluorescent annexin V methods detected by flow cytometry while offering enhanced convenience and richer kinetic information [36].
Multiplexed Experimental Applications
FITC's well-characterized spectral properties facilitate its integration into multiplexed experimental designs. The green fluorescence of FITC conjugates pairs effectively with red fluorescent dyes such as phycoerythrin (PE) and allophycocyanin (APC) for simultaneous detection of multiple cellular parameters [29]. Although these fluorophores exhibit some emission spectrum overlap requiring compensation during flow cytometric analysis, this challenge is readily addressed using single-stained controls to calculate and subtract spectral bleed-through [29]. This multiplexing capability enables researchers to correlate apoptotic induction with other cellular markers, such as surface receptor expression or intracellular signaling events, within the same sample.
The compatibility of FITC with diverse detection modalities extends its utility beyond flow cytometry to include fluorescence microscopy, immunofluorescence, immunohistochemistry, and fluorescent microplate reader assays [31] [29]. This versatility permits correlation of quantitative population data from flow cytometry with spatial and morphological information from microscopy, providing complementary insights into apoptotic processes within complex biological systems. The extensive validation of FITC across these platforms gives researchers confidence in comparing results across experiments and research settings.
Technical Considerations and Optimization Strategies
Conjugation Quality Control
Ensuring consistent, high-quality FITC conjugates requires rigorous quality control measures. The degree of labeling (DOL) must be precisely determined using spectrophotometric methods that separately quantify protein and fluorophore concentrations [29]. This calculation requires knowledge of the molar extinction coefficients for both the unlabeled protein (e.g., 210,000 M⁻¹cm⁻¹ for IgG) and FITC (73,000 M⁻¹cm⁻¹ at 516 nm), along with the correction factor for FITC absorbance at 280 nm (0.254) [29]. The formula for determining protein concentration accounts for the contribution of FITC to the A280 reading: Protein Concentration (M) = [(A280 - (Amax × CF)) / εprotein] × Dilution factor [29]. The DOL is then calculated as: Moles dye per mole protein = [Amax / (εdye × protein concentration)] × Dilution factor [29].
Maintaining consistent DOL across preparations is essential for experimental reproducibility. Variations in labeling efficiency can significantly impact signal intensity and detection sensitivity. For critical applications, small-batch labeling with empirical determination of optimal DOL is recommended rather than relying on theoretical calculations alone [29]. Additionally, thorough removal of unreacted FITC through dialysis, gel filtration, or affinity purification is crucial for minimizing background fluorescence [33] [28]. The tandem affinity purification approach described previously effectively addresses this challenge while simultaneously enhancing protein stability and reducing aggregation [33].
Troubleshooting Common Experimental Issues
Successful implementation of FITC-based detection assays requires anticipation and resolution of common technical challenges. Weak fluorescence signals may result from insufficient annexin V-FITC concentration, expired reagents, or incorrect buffer composition [1]. High background fluorescence often stems from inadequate washing, non-specific binding, or contamination with unreacted FITC [33] [1]. Appropriate controls, including unstained cells, annexin V-only samples, and PI-only samples, are essential for validating staining specificity and informing gating strategies in flow cytometric analysis [1].
For annexin V-FITC apoptosis assays specifically, several pitfalls require attention. Harsh trypsinization of adherent cells can artificially increase annexin V binding by damaging membranes, potentially leading to false positives [1]. Calcium concentration in the binding buffer must be optimized, as deviations from the recommended range can impair annexin V-PS interaction [1]. Additionally, the timing of analysis post-staining is critical, as prolonged delays may permit PI penetration into early apoptotic cells, confounding stage-specific discrimination [1]. Researchers should also note that certain cell types, particularly those with fragile neurite outgrowths, may require protocol modifications to preserve morphological integrity during processing [35].
FITC conjugation remains a powerful enabling technology for sensitive detection across biological research, particularly in apoptosis studies utilizing annexin V-FITC assays. The well-characterized chemistry of FITC conjugation, combined with its optimal spectral properties and instrumentation compatibility, ensures its continued relevance in modern laboratories. While alternative fluorophores with improved photostability and pH resistance have emerged, FITC maintains important advantages in cost-effectiveness, established protocols, and widespread validation. The ongoing development of enhanced detection platforms, such as real-time annexin V assays, demonstrates how traditional detection methodologies continue evolving to address contemporary research needs. As apoptosis research advances toward more complex experimental designs and therapeutic applications, FITC-based detection maintains its fundamental role in elucidating cellular death mechanisms and evaluating therapeutic interventions.
In the study of programmed cell death, the precise distinction between the sequential stages of apoptosis and other forms of cell death is a cornerstone of reliable research, particularly in fields like cancer biology and drug development. The externalization of phosphatidylserine (PS), a membrane phospholipid normally restricted to the inner leaflet of the plasma membrane, is a well-established early event in apoptosis [1]. The annexin V FITC principle leverages this biological phenomenon; the annexin V protein binds with high affinity to exposed PS in a calcium-dependent manner, allowing for the detection of early apoptotic cells [37]. However, this event alone is insufficient for a comprehensive assessment, as the integrity of the plasma membrane must also be evaluated to confirm the stage of cell death. This is where propidium iodide (PI), a classic DNA intercalating dye, plays an indispensable role. PI is excluded from viable and early apoptotic cells due to their intact membranes but penetrates cells in the late stages of apoptosis and necrosis, where membrane integrity is lost [38] [1]. Therefore, the combination of annexin V-FITC and PI provides a powerful, dual-parameter assay that enables researchers to accurately discriminate between viable, early apoptotic, late apoptotic, and necrotic cell populations within a heterogeneous sample [39]. This technical guide delves into the vital role of PI in assessing membrane integrity, detailing protocols, and presenting advanced methodologies to ensure accurate differentiation of cell death stages.
## 2 The Biochemical Principle of Propidium Iodide
Propidium iodide (PI) is a membrane-impermeant fluorescent dye that serves as a critical indicator of plasma membrane integrity. Its mechanism of action is based on its inability to cross intact biological membranes. In a viable cell or a cell in the early stages of apoptosis, the plasma membrane remains functionally intact, effectively excluding PI from entering the cell. Consequently, these cells do not show significant PI fluorescence.
However, during the later stages of apoptosis and in necrotic cell death, the integrity of the plasma and nuclear membranes is compromised [38] [40]. This loss of membrane barrier function allows PI to passively diffuse into the cell, where it intercalates into double-stranded nucleic acids (DNA and RNA) and exhibits a strong red fluorescence upon excitation [38] [41]. It is crucial to note that PI binds to both DNA and RNA, a property that can lead to false-positive staining if cytoplasmic RNA is not removed, a point addressed in advanced protocols [38] [40].
The interpretation of cell death stages is achieved by simultaneously measuring annexin V-FITC binding (green fluorescence) and PI uptake (red fluorescence) via flow cytometry. The resulting data is typically visualized in a scatter plot divided into four quadrants, each representing a distinct cellular state:
- Viable Cells: Annexin V-FITC negative, PI negative (lower-left quadrant).
- Early Apoptotic Cells: Annexin V-FITC positive, PI negative (lower-right quadrant). These cells expose PS but maintain an intact membrane.
- Late Apoptotic Cells: Annexin V-FITC positive, PI positive (upper-right quadrant). These cells expose PS and have lost membrane integrity.
- Necrotic Cells: Annexin V-FITC negative, PI positive (upper-left quadrant). These cells have lost membrane integrity without prior PS exposure, a hallmark of necrosis.
The following diagram illustrates the fundamental workflow and logic of this assay:
## 3 Experimental Protocols for Annexin V/PI Staining
### 3.1 Standard Staining Protocol for Adherent Cells
The following protocol, synthesized from multiple methodologies, is a robust procedure for staining adherent cells (e.g., MDA-MB-231, MCF-7) for flow cytometry analysis [5] [39] [1].
Materials and Reagents:
- Complete cell culture medium.
- Apoptosis-inducing agent (e.g., Doxorubicin, Staurosporine).
- Phosphate-Buffered Saline (PBS), without calcium and magnesium.
- Trypsin/EDTA solution (e.g., 0.25%).
- Annexin V-FITC conjugate.
- Propidium Iodide (PI) solution (e.g., 1 mg/mL).
- Annexin V binding buffer or PBS supplemented with 25 mM CaCl₂.
- Flow cytometry tubes.
Procedure:
- Induction and Harvesting:
- Seed cells (e.g., ( 1 \times 10^6 ) cells) in a T25 flask and allow them to adhere overnight.
- Treat cells with the apoptosis-inducing agent at an optimized concentration (e.g., 1 µM Doxorubicin) for a determined period (e.g., 48 hours) [39].
- Post-treatment, carefully collect the culture supernatant, as it may contain detached (dead) cells. Centrifuge this supernatant to pellet the floating cells.
- Wash the adherent cells with PBS and then detach them using a trypsin/EDTA solution. Neutralize the trypsin with serum-containing medium.
- Combine the trypsinized cells with the pelleted floating cells from the corresponding sample.
Staining:
- Wash the combined cell pellet twice with PBS by centrifugation (300–670 × g for 5 minutes).
- Resuspend the cell pellet (~( 1-5 \times 10^5 ) cells) in 100-500 µL of Annexin V binding buffer.
- Add Annexin V-FITC according to the manufacturer's recommendation (typically 5 µL).
- Add PI to a final concentration of 1-2 µg/mL (e.g., 2 µL of a 1 mg/mL stock) [5] [40].
- Incubate the cells in the dark at room temperature for 15-20 minutes.
Analysis:
- Following incubation, add a additional volume of binding buffer (e.g., 300-500 µL) to the tubes. Note: Some protocols recommend analysis without a post-staining wash to prevent loss of weakly attached apoptotic cells [5].
- Analyze the samples promptly using a flow cytometer equipped with a 488 nm laser. Detect FITC fluorescence typically with a 530/30 nm bandpass filter (FL1) and PI fluorescence with a 575/26 nm or 617 nm bandpass filter (FL2 or FL3).
- Include single-stained controls (Annexin V-FITC only, PI only) and an unstained control to set up compensation and gating accurately.
### 3.2 Modified Protocol with RNase A for Enhanced Accuracy
A significant limitation of conventional PI staining is its affinity for cytoplasmic RNA, which can lead to false-positive events, sometimes up to 40% in cells with low nuclear-to-cytoplasmic ratios [38] [40]. The following modified protocol incorporates a fixation and RNase treatment step to eliminate this artifact, drastically improving accuracy.
Key Modification: This protocol introduces a formaldehyde fixation step after surface staining with Annexin V and PI, which is followed by treatment with RNase A to digest cytoplasmic RNA [38] [40].
Procedure (after staining):
- After the incubation with Annexin V-FITC and PI, add 500 µL of 2% formaldehyde to the cell suspension (in binding buffer) to achieve a final concentration of ~1% formaldehyde. Fix the cells on ice for 10 minutes.
- Wash the cells with 1 mL of PBS by centrifugation (425 × g for 8 minutes).
- Resuspend the cell pellet by flicking the tube.
- Add RNase A to a final concentration of 50 µg/mL (e.g., 16 µL of a 1:100 diluted stock). Incubate for 15 minutes at 37°C.
- Wash the cells once with PBS and resuspend in an appropriate volume of buffer for flow cytometry analysis.
Result: This step removes PI staining that is specific to cytoplasmic RNA, ensuring that the detected PI signal originates solely from nuclear DNA, thereby confirming true loss of membrane integrity [40].
## 4 The Scientist's Toolkit: Essential Reagents and Materials
The following table catalogues the key reagents and equipment required to perform a standard Annexin V/PI apoptosis assay.
| Item Name | Function/Description | Example Catalog Number / Source |
|---|---|---|
| Annexin V-FITC Staining Kit | Provides ready-to-use Annexin V-FITC, PI solution, and incubation buffer for standardized assays. | Abcam (ab14085) [1], Roche (11858777001) [5] |
| Propidium Iodide (PI) | A membrane-impermeant DNA dye used to stain late apoptotic and necrotic cells. | Sigma-Aldrich (P-4864) [40] |
| Annexin V Binding Buffer | Provides the optimal calcium-containing environment for efficient Annexin V binding to PS. | Included in commercial kits or prepared as PBS with CaCl₂ [39] [1] |
| Flow Cytometer | Instrument for quantifying Annexin V and PI fluorescence in single-cell suspensions. | Attune NxT (Thermo Fisher) [42] |
| RNase A | Enzyme used in modified protocols to digest cytoplasmic RNA and prevent false-positive PI staining. | Sigma-Aldrich (R4642) [40] |
| CellEvent Caspase-3/7 Green | An alternative apoptosis assay that detects caspase activation; can be used with PI. | Thermo Fisher Scientific [42] |
## 5 Data Interpretation and Quantification
The quantitative data generated from flow cytometry is summarized in quadrant plots. The table below outlines the definitive interpretation of each cell population based on its staining profile.
| Cell Population | Annexin V-FITC Signal | Propidium Iodide Signal | Biological Interpretation |
|---|---|---|---|
| Viable/Healthy | Negative | Negative | Cell has intact membrane and no externalized PS. |
| Early Apoptotic | Positive | Negative | Cell has externalized PS but maintains membrane integrity. |
| Late Apoptotic | Positive | Positive | Cell has externalized PS and has lost membrane integrity. |
| Necrotic | Negative | Positive | Cell has lost membrane integrity without PS externalization. |
The power of this assay in drug development is its ability to generate quantitative dose-response data. For instance, treating Jurkat T-cells with varying concentrations of cancer drugs like staurosporine or camptothecin and analyzing the percentage of cells in each quadrant allows for the construction of dose-response curves, effectively illustrating a drug's potency in inducing apoptosis [42].
## 6 Advanced Applications and Integrated Analysis
The basic Annexin V/PI assay can be extended to a multiparametric approach that provides deeper insights into signaling pathways and regulatory mechanisms during cell death. This involves combining cell death staining with antibody-based detection of specific protein markers.
A prime application is the investigation of cancer stem cell (CSC) markers during apoptosis. For example, in triple-negative breast cancer cell lines like MDA-MB-231, which are enriched with CD44high/CD24low CSCs, researchers can track how the expression of these surface proteins changes as cells transition from viability to apoptosis. The protocol involves:
- Staining cells with Annexin V-FITC and PI as described.
- Fixing the cells with methanol.
- Performing intracellular staining with fluorochrome-conjugated antibodies (e.g., APC-conjugated anti-CD44) after permeabilization and blocking [39] [43].
This integrated workflow allows for the simultaneous assessment of apoptosis induction and the monitoring of protein expression dynamics within defined cell subpopulations, offering a powerful tool for elucidating mechanisms of therapeutic resistance. The following diagram outlines this advanced multiparametric workflow:
## 7 Troubleshooting and Methodological Limitations
Despite its robustness, researchers must be aware of the limitations and common issues associated with the Annexin V/PI assay.
Common Pitfalls and Solutions:
- High Background PI Staining: This is frequently caused by PI binding to cytoplasmic RNA [38] [40].
- Solution: Implement the modified protocol with RNase A treatment after fixation.
- Weak Annexin V Signal:
- Solution: Ensure the binding buffer contains a sufficient concentration of Ca²⁺. Verify reagent activity and concentration.
- Overestimation of Necrosis: Harsh mechanical handling or over-trypsinization of adherent cells can damage the plasma membrane, causing artifactual PI staining [1].
- Solution: Use gentle pipetting and standardized, gentle trypsinization protocols.
Inherent Limitations:
- The assay cannot distinguish between apoptosis and other forms of programmed cell death that involve PS exposure, such as necroptosis [1].
- It provides no direct information on the upstream apoptotic pathways or caspase activation, though this can be addressed by combining it with caspase assays [1] [42].
- The binding of Annexin V is reversible and calcium-dependent, requiring precise buffer conditions for reproducible results [1].
Propidium iodide remains an indispensable component in the cell biologist's toolkit for its unequivocal role in assessing plasma membrane integrity. When used in concert with annexin V-FITC, it forms the basis of a powerful assay that cleanly distinguishes the transitional stages of cell death. The ongoing refinement of this protocol, including the integration of RNase treatment to eliminate false positives and its combination with antibody staining for multiparametric analysis, ensures its continued relevance in advanced research. By providing a clear, quantitative picture of a cell population's viability status, the Annexin V/PI assay empowers critical discoveries in understanding disease mechanisms and evaluating the efficacy of novel therapeutics.
A Step-by-Step Protocol for Robust Annexin V-FITC/PI Flow Cytometry
Within the framework of apoptosis research utilizing the Annexin V FITC principle, the integrity of the cellular sample is paramount. The core of this methodology relies on the calcium-dependent binding of Annexin V FITC to phosphatidylserine (PS), a phospholipid that translocates from the inner to the outer leaflet of the plasma membrane during early apoptosis [14] [44]. Critically, this assay depends on the presence of an intact plasma membrane to distinguish apoptotic cells (Annexin V positive, viability dye negative) from necrotic or late-stage apoptotic cells (Annexin V positive, viability dye positive) [14] [45]. Consequently, improper sample preparation can mechanically or chemically compromise cell membranes, leading to a high rate of false positives and invalid experimental data [46] [1]. This guide details optimized protocols for handling both suspension and adherent cell types to preserve this vital membrane asymmetry and integrity from the moment of harvest through to analysis.
Core Principles of the Annexin V FITC Assay
The Annexin V FITC assay is a powerful flow cytometric method for the early detection of apoptosis. Its validity rests entirely on two foundational principles: the specific biochemical event it detects and the preservation of cellular structural integrity.
PS Externalization: In viable, healthy cells, phosphatidylserine (PS) is restricted to the inner, cytoplasmic leaflet of the plasma membrane. A hallmark of early apoptosis is the loss of this membrane asymmetry, resulting in the exposure of PS on the cell's outer surface [1] [44]. Annexin V is a 35-36 kDa natural protein that binds to PS with high affinity in a calcium-dependent manner [45] [44]. By conjugating Annexin V to the fluorescein isothiocyanate (FITC) fluorochrome, cells undergoing early apoptosis can be specifically labeled and detected [14].
Viability Staining for Membrane Integrity: PS externalization is not unique to apoptosis; it also occurs during necrosis. The key distinction lies in the integrity of the plasma membrane [14]. To make this critical distinction, the Annexin V stain is always used in conjunction with a viability dye such as propidium iodide (PI) or 7-AAD [45] [44]. These dyes are normally excluded from cells with intact membranes. Therefore, a cell that is Annexin V positive but PI negative is classified as being in early apoptosis, as its membrane is still intact. A cell that is positive for both Annexin V and PI has lost its membrane integrity and is considered to be in the late stages of apoptosis or already dead via necrosis [44]. The classification of cell states based on this dual staining is summarized in Table 1.
Table 1: Interpretation of Cell States Based on Annexin V and Propidium Iodide Staining
| Annexin V FITC | Propidium Iodide (PI) | Interpretation |
|---|---|---|
| Negative | Negative | Viable cell, not undergoing apoptosis [45] [44] |
| Positive | Negative | Early apoptotic cell, with PS exposure and an intact membrane [45] [44] |
| Positive | Positive | Late apoptotic or necrotic cell, with PS exposure and a compromised membrane [45] [44] |
| Negative* | Positive | Damaged or dead cell (rare, but can occur in severe necrosis) |
This biochemical and physical basis of the assay dictates that every step of sample preparation must be designed to minimize artificial damage to the plasma membrane, which would otherwise lead to non-specific Annexin V binding and PI uptake, thereby confounding the experimental results [1].
Universal Pre-Staining Considerations
Before embarking on cell-type-specific procedures, several universal requirements and preparatory steps apply to all Annexin V FITC experiments.
Critical Buffer and Environmental Requirements
Calcium is Mandatory: The binding of Annexin V to PS is absolutely dependent on calcium ions [47] [45]. All staining must be performed in a specialized 1X Binding Buffer that typically contains 2.5 mM CaCl₂ [46] [44]. Crucially, buffers containing calcium chelators like EDTA or EGTA must be scrupulously avoided during the staining steps, as they will completely abrogate Annexin V binding [47].
Timing and Temperature: The staining process should be performed at room temperature and protected from light to preserve fluorochrome integrity [47] [46]. Once stained, samples must be analyzed by flow cytometry within 1 hour to prevent deterioration of cell viability and staining fidelity [46] [45] [44].
Appropriate Controls: Setting up correct controls is non-negotiable for accurate flow cytometry gating and data interpretation. Essential controls include [46] [45]:
Research Reagent Solutions
The following table outlines the essential materials required for performing a standard Annexin V FITC apoptosis detection assay.
Table 2: Essential Reagents and Materials for Annexin V FITC Staining
| Item | Function / Description | Example Catalog Numbers |
|---|---|---|
| Annexin V FITC Conjugate | Fluorescent probe that binds exposed phosphatidylserine. | Cat. No. 556420, 556419 [46] [45] |
| Propidium Iodide (PI) | Cell-impermeant viability dye that stains nucleic acids in dead/damaged cells. | Cat. No. 556463 [46] [45] |
| 10X Binding Buffer | Concentrated buffer diluted to create a 1X working solution with optimal Ca²⁺ concentration for Annexin V binding. | Cat. No. 556454 [46] [44] |
| Fixable Viability Dyes (FVD) | Alternative to PI for complex multi-color flow panels; allows subsequent fixation/permeabilization. | FVD eFluor 660, 506, or 780 [47] |
| Flow Cytometry Staining Buffer | Protein-supplemented buffer for washing and resuspending cells to reduce background staining. | Cat. No. 00-4222 [47] |
Cell-Type-Specific Protocols
The fundamental difference in sample preparation lies in the initial harvesting of cells, where suspension and adherent cells require distinctly different approaches to preserve membrane integrity.
Protocol for Suspension Cells
Suspension cells, such as Jurkat or HL-60 lines, are inherently simpler to prepare for Annexin V staining as they do not require detachment from a substrate. The following workflow visualizes the key steps and critical points for handling suspension cells.
Detailed Procedure:
Harvesting and Washing: Collect cells by gentle centrifugation (e.g., 400-600 x g for 5 minutes). Carefully aspirate the supernatant and gently resuspend the cell pellet in cold, calcium-free 1X PBS. Repeat the centrifugation and washing step to remove any culture media that may contain EDTA or other chelators [47] [46].
Resuspension in Binding Buffer: After the final wash, thoroughly aspirate the PBS supernatant. Gently resuspend the cell pellet in 1X Binding Buffer at a density of 1-5 x 10⁶ cells/mL [47] [46].
Staining: Transfer a 100 µL aliquot of the cell suspension (containing ~1 x 10⁵ cells) to a flow cytometry tube. Add 5 µL of Annexin V FITC, gently vortex the tube, and incubate for 15 minutes at room temperature in the dark [46] [45] [44]. Following this, add 5 µL of Propidium Iodide (PI) solution. Gently mix and incubate for an additional 5-15 minutes on ice or at room temperature, protected from light. Do not wash the cells after adding PI, as this would remove the dye from the solution [47] [45].
Analysis: Shortly before analysis, add 400 µL of 1X Binding Buffer to the tube to prevent cells from settling [46] [48]. Analyze the samples by flow cytometry immediately, ideally within 1 hour.
Protocol for Adherent Cells
The preparation of adherent cells is more technically challenging, as the process of detaching them from the culture surface poses a significant risk of inducing mechanical and enzymatic damage, leading to false-positive Annexin V staining. The workflow below highlights the critical considerations specific to adherent cells.
Detailed Procedure and Critical Considerations:
Gentle Detachment is Paramount: The choice of detachment method is the most critical factor for success with adherent cells.
- Non-Enzymatic Methods (Recommended): Whenever possible, use a non-enzymatic cell dissociation buffer. These buffers, typically based on EDTA or other chelating agents, work by sequestering calcium and magnesium ions that cells use to adhere, causing them to detach with minimal proteolytic damage to surface proteins and the plasma membrane. Note: Any EDTA introduced at this stage must be thoroughly removed by washing with PBS before resuspending in the calcium-containing Binding Buffer [1].
- Enzymatic Methods (Use with Caution): If trypsinization is unavoidable, use a low concentration of trypsin for the shortest possible duration. Critically, the trypsin must be inactivated with serum-containing media immediately after detachment, as serum contains trypsin inhibitors. The cells must then be washed thoroughly with PBS to remove the serum before proceeding to staining [1]. It is critical to note that trypsin can cleave surface proteins and may potentially damage the membrane, leading to artifactual Annexin V binding [46] [45].
Handling and Staining: After detachment, collect the cells by gentle centrifugation. Wash the cell pellet once with cold PBS and then once with 1X Binding Buffer. From this point onward, the staining protocol is identical to that for suspension cells: resuspend in Binding Buffer, stain with Annexin V FITC, then add PI without a final wash, and analyze promptly [47] [1].
Alternative Approach: Staining in Situ: For some experimental designs, it is possible to stain adherent cells directly on the culture plate or a coverslip before detachment. After inducing apoptosis, cells are incubated with Annexin V FITC and PI in Binding Buffer directly. They can then be visualized directly under a fluorescence microscope, or gently detached (e.g., using a rubber policeman) and analyzed by flow cytometry. This method can minimize stress but may present challenges for quantitative flow cytometric analysis [1].
Troubleshooting and Data Interpretation
Even with optimized protocols, researchers may encounter issues. The following points address common challenges and the nuances of data analysis.
High Background/Necrotic Population: A persistently high percentage of Annexin V+/PI+ cells in control samples often points to sample preparation issues. This can be caused by overly harsh trypsinization of adherent cells, excessive centrifugation force or speed, vortexing too vigorously, or delays in analysis [1]. Re-optimizing the detachment and handling protocol is essential.
Weak Annexin V Signal: A weak signal could result from incorrect buffer composition. Always verify that the 1X Binding Buffer was prepared correctly and that the final staining solution contains a sufficient concentration of free calcium ions (Ca²⁺). The use of EDTA-containing buffers at any point during staining will cause this issue [47].
Interpreting the Kinetic Process: Apoptosis is a dynamic process. A single time-point measurement showing Annexin V+/PI+ cells indicates only that cells have died, without revealing the mechanism. To confidently conclude that apoptosis occurred, it is informative to track the population over time. A clear progression of cells from Annexin V-/PI- (viable) to Annexin V+/PI- (early apoptotic) and finally to Annexin V+/PI+ (late apoptotic/dead) provides strong evidence for an apoptotic cascade [44].
The annexin V FITC assay is a cornerstone technique for detecting early apoptosis in biomedical research, functioning through the calcium-dependent binding of annexin V to phosphatidylserine (PS) exposed on the outer leaflet of the plasma membrane. The fidelity of this assay is critically dependent on specific buffer conditions, particularly the presence of calcium ions and the exclusion of chelating agents. This technical guide delves into the biochemical principles underpinning these requirements, provides detailed validated protocols, and offers a comprehensive toolkit to ensure the accurate detection of apoptotic cells for researchers and drug development professionals.
Annexin V is a 35–36 kDa protein that binds with high affinity to phosphatidylserine (PS), a phospholipid normally confined to the inner, cytoplasmic leaflet of the plasma membrane in viable cells. During the early stages of apoptosis, cells lose membrane asymmetry and PS is translocated to the outer leaflet, making it accessible for annexin V binding. This externalized PS serves as an "eat-me" signal for phagocytosis by macrophages. [49] [50]
The interaction between annexin V and PS is strictly calcium-dependent. The binding is mediated by calcium ions (Ca²⁺) that form a bridge between the protein and the negatively charged head groups of PS on the membrane surface. Consequently, the presence of calcium is a non-negotiable prerequisite for the assay, while chelating agents that sequester calcium, such as Ethylenediaminetetraacetic acid (EDTA), will completely abrogate binding and render the assay useless. [47] [51] [1]
The Critical Role of Calcium and EDTA-Free Buffers
Calcium as a Molecular Bridge
Calcium ions are fundamental co-factors in the annexin V-PS interaction. Research on the binding parameters of annexin V to erythrocyte ghosts has demonstrated that pre-addition of EDTA to reaction mixtures totally prevents membrane binding. The binding exhibits positive cooperativity, with calcium titration studies yielding a Hill coefficient of approximately 4, indicating that multiple calcium ions are involved in the binding event and that the binding of one calcium ion facilitates the binding of subsequent ions. [51] This underscores the critical concentration of free calcium required for effective and sensitive detection of apoptosis.
The Deleterious Effects of Chelators
Chelating agents like EDTA and EGTA pose a significant threat to the integrity of the annexin V assay. By binding to calcium ions in solution, they make these ions unavailable for the annexin V-PS interaction. The Thermo Fisher protocol explicitly states: "Due to the calcium dependence of the Annexin V:PS interaction, it is critical to avoid buffers containing EDTA or other calcium chelators during Annexin V experiments." [47] Even after binding has occurred, the addition of EDTA can reverse the interaction, highlighting its reversible nature and the persistent need for calcium to maintain the bond. [51]
Recommended Buffer Compositions and Formulations
A properly formulated binding buffer must provide adequate calcium ions while maintaining physiological pH and osmolarity. The standard is a HEPES-buffered saline solution containing 2.5 mM calcium chloride. [47] [50] [46]
Table 1: Standard 1X Annexin V Binding Buffer Composition
| Component | Concentration | Function |
|---|---|---|
| HEPES | 10 mM | Maintains physiological pH (7.4) |
| Sodium Chloride (NaCl) | 140 mM | Provides physiological osmolarity |
| Calcium Chloride (CaCl₂) | 2.5 mM | Essential co-factor for Annexin V-PS binding |
Commercial 10X binding buffers are commonly available and require dilution with distilled water. For instance, the BD Biosciences 10X Binding Buffer is composed of 0.1 M HEPES (pH 7.4), 1.4 M NaCl, and 25 mM CaCl₂. [46] It is crucial that all buffers used during cell harvesting and staining—including wash buffers—are free of EDTA and other chelators. Azide-free and serum/protein-free PBS is recommended for washing steps prior to staining when using fixable viability dyes. [47]
Detailed Experimental Protocol for Annexin V FITC Staining
The following protocol is adapted from leading commercial providers and is optimized for flow cytometry. [47] [1] [46]
Materials Required
- Cells of interest (suspension or adherent)
- Annexin V FITC conjugate
- Propidium Iodide (PI) or 7-AAD viability dye
- 1X Annexin V Binding Buffer (Calcium-containing, EDTA-free)
- EDTA-free Phosphate-Buffered Saline (PBS)
- Flow cytometry tubes
- Centrifuge
Step-by-Step Procedure
- Cell Harvesting: Harvest cells gently. For adherent cells, use a non-enzymatic dissociation method or mild trypsinization followed by a wash in serum-containing media to inhibit trypsin, which can damage the membrane and cause false positives. [1]
- Washing: Wash cells once with cold, EDTA-free PBS and then once with 1X Annexin V Binding Buffer. Centrifuge at 300-600 x g for 5 minutes. [47] [46]
- Cell Suspension: Resuspend the cell pellet in 1X Binding Buffer at a density of 1-5 x 10⁶ cells/mL. [47]
- Staining:
- Viability Staining:
- Analysis:
The workflow and the critical role of calcium in the binding event are summarized in the diagram below.
Essential Controls and Data Interpretation
Appropriate controls are mandatory for accurate data interpretation in flow cytometry. [46]
Table 2: Required Controls for Annexin V FITC / PI Assay
| Control Sample | Purpose | Quadrant Setup |
|---|---|---|
| Unstained Cells | To set background fluorescence and voltage. | Baseline for all quadrants. |
| Annexin V FITC Only | To define the annexin V-positive population and compensate for FITC spillover into the PI channel. | Sets lower right (Annexin V+/PI-) quadrant. |
| PI Only | To define the PI-positive population and compensate for PI spillover into the FITC channel. | Sets upper left (Annexin V-/PI+) quadrant. |
| Induced Apoptosis (Positive Control) | To validate the assay performance. | Should show a clear population in the annexin V-positive quadrants. |
The data from a dual-stained sample is interpreted using a quadrant plot:
- Viable Cells: Annexin V negative / PI negative (lower left quadrant).
- Early Apoptotic Cells: Annexin V positive / PI negative (lower right quadrant). These cells have exposed PS but an intact membrane that excludes PI.
- Late Apoptotic/Necrotic Cells: Annexin V positive / PI positive (upper right quadrant). These cells have exposed PS and a compromised membrane that allows PI to enter and stain DNA.
The Researcher's Toolkit: Essential Reagents and Materials
Table 3: Essential Reagents for Annexin V Staining
| Item | Function / Description | Example Product Codes |
|---|---|---|
| Annexin V Conjugate | Fluorescently-labeled protein (e.g., FITC, PE, APC) that binds to exposed PS. | eFluor 450, FITC, PE, APC [47] |
| Viability Dye | Membrane-impermeant dye to identify dead/necrotic cells (e.g., PI, 7-AAD). | Propidium Iodide, 7-AAD, SYTOX Green [47] [49] [46] |
| 10X Binding Buffer | Concentrated buffer to be diluted; provides correct ionic strength and Ca²⁺. | 0.1 M HEPES, 1.4 M NaCl, 25 mM CaCl₂ [46] |
| EDTA-free PBS | For washing cells without disrupting the calcium-dependent binding. | N/A |
| Fixable Viability Dyes (FVD) | For experiments requiring fixation after staining; covalently label compromised cells. | FVD eFluor 660, 506, 780 [47] |
Troubleshooting Common Buffer-Related Issues
- Weak or No Staining: The most common cause is the absence of calcium or presence of a chelator (EDTA/EGTA) in the wash or binding buffers. Always check buffer compositions. [47] [51]
- High Background in All Channels: Can be caused by cell debris and aggregates. Ensure a single-cell suspension and filter cells through a mesh before analysis.
- Excessive Cell Death (High PI staining): Can result from overly harsh cell harvesting techniques (e.g., vigorous scraping, prolonged trypsinization). Use gentle dissociation methods. [1] [50]
- Inconsistent Results Between Replicates: Ensure the binding buffer and stained cells are kept on ice and analyzed promptly, as prolonged storage at room temperature can affect cell viability and staining intensity. [47] [50]
The accuracy and reliability of the annexin V FITC apoptosis assay are profoundly dependent on meticulous attention to buffer conditions. The absolute requirement for calcium and the corresponding exclusion of chelating agents like EDTA are not merely technical notes but foundational biochemical principles that dictate the success of the experiment. By adhering to the detailed protocols, buffer formulations, and troubleshooting guidance outlined in this whitepaper, researchers can confidently utilize this powerful technique to generate robust, quantifiable data on programmed cell death, thereby advancing our understanding in fields from basic cell biology to drug discovery.
The Annexin V-FITC and Propidium Iodide (PI) staining protocol is a cornerstone technique in apoptosis research, enabling the quantitative distinction between viable, early apoptotic, and late apoptotic or necrotic cell populations. This method leverages the precise biochemical events that characterize programmed cell death, specifically the loss of plasma membrane asymmetry [11]. For researchers and drug development professionals, rigorous optimization of this assay is critical for generating reproducible, high-quality data, particularly when evaluating the efficacy of novel therapeutic compounds. This guide provides a detailed, evidence-based framework for optimizing the incubation steps central to this powerful methodology.
Principles of the Annexin V-FITC/PI Assay
Biochemical Basis of Apoptosis Detection
A fundamental early event in the apoptotic cascade is the rapid translocation of the phospholipid phosphatidylserine (PS) from the inner to the outer leaflet of the plasma membrane [49] [11]. This "eat-me" signal marks the cell for recognition and clearance by phagocytes. The assay is built upon the high affinity of Annexin V, a 35-36 kDa cellular protein, for PS in a calcium-dependent manner [52] [1]. By conjugating Annexin V to the fluorescent tag Fluorescein Isothiocyanate (FITC), cells undergoing apoptosis can be specifically labeled and detected via flow cytometry.
To differentiate apoptosis from other forms of cell death, the DNA-binding dye Propidium Iodide (PI) is used concurrently. PI is impermeant to live and early apoptotic cells with intact membranes. However, in late-stage apoptosis and necrosis, the loss of membrane integrity allows PI to enter the cell, intercalate into nucleic acids, and emit a red fluorescence [53] [1]. This dual-staining strategy allows for the simultaneous assessment of both membrane asymmetry and membrane integrity.
Population Differentiation by Flow Cytometry
The power of this assay lies in its ability to resolve four distinct cell populations based on their fluorescence profile:
- Viable Cells (Annexin V-FITC⁻/PI⁻): Exhibit minimal fluorescence, indicating intact membranes and no externalized PS.
- Early Apoptotic Cells (Annexin V-FITC⁺/PI⁻): Bind Annexin V-FITC but exclude PI, demonstrating externalized PS with a maintained membrane barrier.
- Late Apoptotic Cells (Annexin V-FITC⁺/PI⁺): Stain positively for both dyes, indicating PS externalization and a loss of membrane integrity.
- Necrotic Cells (Annexin V-FITC⁻/PI⁺): Typically show intense PI staining with little Annexin V binding, though this population can be difficult to distinguish from late apoptotic cells that have undergone secondary necrosis [49] [1].
Table 1: Interpretation of Annexin V-FITC/PI Staining Results
| Cell Population | Annexin V-FITC | Propidium Iodide | Cellular State |
|---|---|---|---|
| Viable | Negative | Negative | Healthy, non-apoptotic |
| Early Apoptotic | Positive | Negative | Undergoing early apoptosis |
| Late Apoptotic | Positive | Positive | Undergoing late apoptosis |
| Necrotic | Negative (or Weak) | Positive | Necrotic (or late apoptotic) |
Detailed Optimized Staining Protocol
Reagent Preparation and Critical Components
The success of the assay is highly dependent on proper reagent preparation. A key component is the 1X Binding Buffer, which must contain calcium (typically 2.5 mM CaCl₂) to facilitate Annexin V binding [46] [47]. Buffers containing EDTA or other calcium chelators must be strictly avoided as they will inhibit staining [47]. It is recommended to use cold (2-8°C) PBS for initial cell washes and to prepare the binding buffer immediately before use.
Table 2: Key Reagent Formulations and Storage
| Reagent | Composition / Example | Storage & Handling |
|---|---|---|
| 10X Binding Buffer | 0.1 M HEPES (pH 7.4), 1.4 M NaCl, 25 mM CaCl₂ [46] | Store as directed; dilute to 1X with distilled water before use. |
| 1X Binding Buffer | 10 mM HEPES/NaOH (pH 7.4), 140 mM NaCl, 2.5 mM CaCl₂ [54] | Prepare fresh and keep at 2-8°C. |
| Annexin V-FITC | Recombinant protein conjugated to FITC [52] | Aliquot and protect from light; store at recommended temperature (often -20°C). |
| Propidium Iodide (PI) | Nucleic acid dye solution (e.g., 20-50 µg/mL) [53] [54] | Protect from light; store at 2-8°C. |
Step-by-Step Staining Procedure
The following protocol is optimized for suspension cells or trypsinized adherent cells. Gentle handling is paramount to prevent mechanical induction of necrosis.
- Cell Harvesting and Washing: Harvest and wash cells twice with cold PBS by centrifugation (e.g., 300-400 x g for 5 minutes). For adherent cells, use gentle trypsinization (without EDTA if possible) and quench with serum-containing media before washing [1].
- Cell Resuspension: Resuspend the cell pellet in cold 1X Binding Buffer to a density of 1-5 x 10⁶ cells/mL [46] [47].
- Staining Incubation: Transfer 100 µL of the cell suspension (~1-5 x 10⁵ cells) to a flow cytometry tube. Add 5 µL of Annexin V-FITC and 2-5 µL of PI [46] [47]. The optimal volume of PI may require titration, starting with 2 µL per test [46].
- Incubation Parameters: Gently vortex the tubes and incubate for 15 minutes at room temperature (20-25°C) in the dark [46] [47]. The incubation time can be adjusted between 10-20 minutes based on cell type and reagent validation.
- Post-Staining Handling: After incubation, immediately add 300-400 µL of cold 1X Binding Buffer to each tube [46]. Do not wash the cells after adding PI, as this would remove the dye from the solution [47].
- Flow Cytometric Analysis: Keep samples on ice and protected from light. Analyze by flow cytometry within 1 hour to prevent deterioration of the staining profile and loss of cell viability [46] [47].
The following workflow diagram summarizes the key steps of this procedure.
Essential Controls for Assay Validation
To ensure accurate data interpretation and proper instrument setup, the following controls are mandatory [46]:
- Unstained Cells: For setting fluorescence baselines and background.
- Annexin V-FITC Single Stain: For flow cytometry compensation in the FITC channel.
- PI Single Stain: For flow cytometry compensation in the PI/PE channel.
- Induced Apoptosis Positive Control: Treat cells with a known apoptosis inducer (e.g., 10 µM camptothecin for 4 hours [49]) to confirm assay performance.
- Specificity Control (Optional): Pre-incubate cells with an excess of unconjugated Annexin V to block binding sites, followed by Annexin V-FITC, to demonstrate staining specificity [46].
Critical Optimization Parameters
Incubation Conditions
The incubation step is a critical variable. Extending incubation time or temperature can increase non-specific binding and promote cell death. Adhering to the recommended 15 minutes at room temperature is a safe starting point. If necessary, incubation on ice can be used, but binding kinetics may be slower. The assay must be performed on live, unfixed cells, as fixation permeabilizes the membrane, allowing Annexin V to access internal PS and causing false positives [49] [1].
Avoiding Common Pitfalls and False Positives
- Calcium is Essential: The binding buffer must contain Ca²⁺. Verify the absence of EDTA or other chelators in any buffer used prior to or during the staining process [47].
- Cell Handling: Excessive centrifugation force, vortexing, or harsh trypsinization can damage the plasma membrane, leading to increased PI-positive events and false Annexin V binding to the inner membrane leaflet [1].
- Timely Analysis: Delaying analysis beyond 1 hour can result in a time-dependent increase in apoptosis and necrosis, altering the population distribution [46] [47].
- Gating Strategy: Use forward and side scatter parameters to exclude debris, but be aware that apoptotic cells often shrink and show reduced forward scatter.
The Scientist's Toolkit: Essential Research Reagents
A successful experiment relies on a set of well-defined reagents and materials. The table below lists the essential components for the Annexin V-FITC/PI apoptosis detection assay.
Table 3: Key Research Reagent Solutions for Annexin V-FITC/PI Assay
| Reagent/Material | Function / Purpose | Key Considerations |
|---|---|---|
| Annexin V-FITC Conjugate | Binds to externalized phosphatidylserine (PS) on apoptotic cells. | High affinity and specificity for PS; calcium-dependent binding [52] [49]. |
| Propidium Iodide (PI) | Cell-impermeant viability dye; stains nucleic acids in dead cells. | Distinguishes late apoptotic/necrotic (PI+) from early apoptotic (PI-) cells [53] [1]. |
| 10X / 5X Binding Buffer | Provides optimal calcium and pH environment for Annexin V binding. | Must contain CaCl₂; avoid EDTA-containing buffers [46] [47]. |
| Phosphate-Buffered Saline (PBS) | Used for washing cells to remove media and residual calcium chelators. | Should be calcium- and magnesium-free; cold temperature helps preserve cell viability. |
| Flow Cytometry Tubes | Hold cell suspension for staining and analysis. | Round-bottom tubes are preferred for consistent analysis. |
Advanced Applications and Protocol Variations
The basic Annexin V/PI protocol can be adapted for more complex experimental designs. For multicolor flow cytometry panels, Annexin V conjugated to other fluorochromes (e.g., PE, APC, eFluor dyes) is available [47] [49]. When combining with intracellular staining for other targets, the Annexin V staining must be performed after cell surface staining but before fixation and permeabilization, as these steps will compromise membrane integrity [47]. Alternative viability dyes, such as 7-AAD or Fixable Viability Dyes (FVDs), can be substituted for PI, with FVDs offering the advantage of being compatible with subsequent fixation steps [46] [47].
The optimized Annexin V-FITC and PI staining protocol provides a robust and quantitative method for dissecting the stages of cell death. Precision in execution—from reagent preparation and gentle cell handling to strict adherence to incubation times and the use of appropriate controls—is the key to obtaining reliable and interpretable data. As a fundamental tool in cell biology, oncology, and drug discovery, this assay's proper implementation allows researchers to accurately assess the mechanistic impact of genetic, chemical, and environmental perturbations on cellular fate, thereby providing critical insights in the pursuit of novel therapies.
Flow cytometry serves as a powerful analytical technique for the multiparametric analysis of physical and chemical characteristics of single cells or particles in suspension. Within the specific context of apoptosis research, precise instrument configuration and fluorescence detection are paramount for acquiring reliable and reproducible data. This technical guide provides an in-depth examination of core setup principles, with a specific focus on applications involving Annexin V FITC for detecting programmed cell death. The accuracy of such detection hinges on a thorough understanding of the instrument's lasers, optical filters, and detectors, and their correct configuration to capture the spectral signatures of fluorescent probes. The following sections will detail the essential components of a flow cytometer, guide the selection of appropriate fluorescent reagents, and provide a concrete experimental protocol for apoptosis detection, thereby establishing a robust foundation for research and drug development professionals.
Core Principles of Flow Cytometry Configuration
Instrument Components and Their Functions
A flow cytometer operates through a coordinated system of fluidics, optics, and electronics. The fluidic system hydrodynamically focuses a cell suspension so that cells pass single-file through one or more focused laser beams. The optics system, comprising lasers and lenses, illuminates the cells, while a series of filters and detectors then collect the resulting light signals. These signals include scattered light, which provides information about cell size and internal complexity, and emitted fluorescence from probes bound to the cell [55].
The specific configuration of lasers and optical filters directly determines which fluorophores can be detected and the quality of the resulting data. Each laser emits light at a specific wavelength, and a fluorophore must be excited by a laser with a wavelength close to its own excitation peak for optimal detection [56]. For instance, a 488 nm laser is ideal for exciting FITC, which has a maximum excitation wavelength of 490 nm [56]. Following excitation, the emitted fluorescence from the fluorophore is collected and directed through a series of optical filters. These filters—including dichroic mirrors (which reflect or transmit specific wavelengths), bandpass filters (which transmit a specific range), and longpass filters (which transmit wavelengths above a cutoff)—precisely route the light to the appropriate detectors [55] [56]. A proper understanding of this optical path is critical for panel design and minimizing spectral overlap.
The Criticality of Fluorescence Detection Setup
The configuration of fluorescence detection channels is not a mere technicality but a fundamental determinant of data integrity. A core challenge in multicolor flow cytometry is spectral overlap, where the emission spectrum of one fluorophore is partially detected in the channel of another [55]. This phenomenon can generate false-positive signals and must be corrected through a process called compensation [55] [57].
- Compensation: This is a mathematical correction applied during data analysis to ensure that the signal in a given detector is derived solely from its intended fluorophore. To set compensation correctly, single-stained controls (cells or beads stained with only one fluorophore) are essential. These controls measure the amount of "spillover" from one channel into another, allowing the software to calculate and apply the necessary correction factors [55] [57]. As noted in publishing guidelines, "Uncompensated or improperly compensated samples result in measurement artifacts and improper quantification of antigen density" [57].
- Panel Design Strategy: A well-designed panel strategically assigns fluorophores to cellular markers. The brightest fluorophores (such as PE or APC) should be reserved for detecting low-abundance antigens or rare cell populations, while dimmer fluorophores can be used for highly expressed antigens [55]. This strategy ensures a high signal-to-noise ratio and clear resolution of positive populations from negative ones.
Instrument Setup for Annexin V FITC Apoptosis Detection
Laser and Filter Configuration
The successful detection of apoptosis using an Annexin V FITC conjugate is dependent on the precise alignment of the fluorophore's spectral properties with the instrument's optical configuration. FITC (Fluorescein Isothiocyanate) has a maximum excitation wavelength of approximately 490 nm and a maximum emission wavelength of approximately 520 nm [49] [56]. Consequently, it is optimally excited by the ubiquitous 488 nm blue laser [56].
The emitted fluorescence is then typically collected through a 525/40 nm or 530/30 nm bandpass filter [49] [56]. This filter allows a narrow window of green light, centered on FITC's emission peak, to reach the photomultiplier tube (PMT) detector. A common instrument configuration for a basic apoptosis assay using Annexin V FITC and Propidium Iodide (PI) is detailed in the table below. PI is excited at 535 nm and emits at 617 nm, and is typically detected through a filter such as 610/20 nm or 585/42 nm under the 488 nm laser [49] [58].
Table 1: Example Instrument Configuration for Annexin V FITC/PI Apoptosis Assay
| Laser Line | Fluorochrome | Recommended Filter (Bandpass) | Detected Parameter |
|---|---|---|---|
| 488 nm | Annexin V FITC | 525/40 nm or 530/30 nm | Early Apoptosis |
| 488 nm | Propidium Iodide (PI) | 610/20 nm or 585/42 nm | Necrosis / Late Apoptosis |
| 488 nm | Forward Scatter (FSC) | N/A | Cell Size |
| 488 nm | Side Scatter (SSC) | N/A | Cell Granularity/Complexity |
Workflow for Apoptosis Detection by Flow Cytometry
The following diagram illustrates the logical sequence of steps involved in configuring a flow cytometer and acquiring data for an Annexin V FITC-based apoptosis experiment.
Flow Cytometry Setup Workflow
The Scientist's Toolkit: Reagents and Experimental Protocol
Research Reagent Solutions
A successful apoptosis assay relies on a specific set of reagents, each serving a critical function. The selection guide below outlines the core components.
Table 2: Essential Reagents for Annexin V FITC Apoptosis Detection
| Item | Function/Description | Example |
|---|---|---|
| Annexin V Conjugate | Binds to phosphatidylserine (PS) exposed on the outer leaflet of the plasma membrane in apoptotic cells. | Annexin V FITC [5] [58] |
| Viability Dye | A cell-impermeant dye that distinguishes dead/necrotic cells with compromised membranes. | Propidium Iodide (PI) [5] [49] |
| Binding Buffer | Provides a calcium-rich environment essential for the Ca2+-dependent binding of Annexin V to PS. | 1X Annexin Binding Buffer [49] [58] |
| Positive Control | Induces apoptosis in cell culture to serve as a robust positive control for staining. | Camptothecin [49] |
| Compensation Controls | Unstained and single-stained cells/beads used to calibrate the instrument and correct for spectral overlap. | [55] [57] |
Detailed Experimental Protocol for Annexin V Staining
The following is a standardized protocol for detecting early apoptosis using an Annexin V FITC kit, adapted from established methods [5] [58].
Materials and Reagents:
- Annexin V FITC conjugate
- Propidium Iodide (PI) solution
- 10X Annexin V Binding Buffer
- Cell culture of interest (e.g., Jurkat cells)
- Apoptosis-inducing agent for positive control (e.g., 10 µM Camptothecin, 4 hours)
- Flow cytometry tubes
- Centrifuge
- Ice
- Flow cytometer equipped with a 488 nm laser
Procedure:
Sample Preparation:
- Induce apoptosis in your test sample(s) using your chosen method. Include an untreated negative control.
- Collect cells, both adherent and floating, by gentle centrifugation (e.g., 670 × g for 5 minutes at room temperature) [5].
- Wash cells once with cold PBS and once with 1X Annexin V Binding Buffer.
Staining:
- Resuspend the cell pellet in 1X Annexin V Binding Buffer at a density of 1x10^5 to 1x10^6 cells/mL [58].
- Aliquot 100 µL of cell suspension into flow cytometry tubes.
- Add 1-2 µL of Annexin V FITC conjugate and 5-12.5 µL of PI solution to the experimental tubes [5] [58]. Note: Precise volumes should be optimized and can vary by kit.
- Prepare single-stained controls for compensation:
- Unstained cells (cells + buffer only).
- Annexin V FITC only (cells + Annexin V FITC).
- PI only (cells + PI).
- Gently vortex the tubes and incubate for 10-15 minutes on ice, protected from light.
Acquisition and Analysis:
- After incubation, add a additional 200-400 µL of cold 1X Annexin V Binding Buffer to each tube and analyze immediately on the flow cytometer [5] [58].
- Using the single-stained controls, adjust the instrument's PMT voltages and set the compensation matrix to correct for FITC spillover into the PI channel and vice versa.
- Acquire a minimum of 10,000 events per sample.
- Analyze the data by creating a bivariate dot plot of Annexin V FITC (x-axis) vs. PI (y-axis). The quadrants are interpreted as follows:
- Annexin V-FITC negative / PI negative (Lower Left): Viable, non-apoptotic cells.
- Annexin V-FITC positive / PI negative (Lower Right): Early apoptotic cells.
- Annexin V-FITC positive / PI positive (Upper Right): Late apoptotic or necrotic cells.
- Annexin V-FITC negative / PI positive (Upper Left): Primarily necrotic cells or cellular debris.
Advanced Applications: Spectral Flow Cytometry
Spectral flow cytometry represents a significant technological advancement, offering enhanced capabilities for complex multicolor panels. Unlike conventional flow cytometry, which uses optical filters to direct specific wavelength ranges to dedicated detectors, spectral cytometry collects the full emission spectrum of every fluorophore across all detectors [59]. The instrument then uses reference controls from single-stained samples to "unmix" the complex composite signal from a multicolor-stained cell, leveraging the unique spectral fingerprint of each fluorophore [59].
This paradigm shift enables the resolution of fluorophores with highly overlapping emission spectra, such as APC and Alexa Fluor 647, which are challenging to distinguish on conventional instruments [59]. Furthermore, spectral unmixing can often identify and digitally remove autofluorescence, thereby improving the signal-to-noise ratio for dim markers [59]. For apoptosis research, this allows for the seamless integration of Annexin V conjugates into larger, high-parameter panels to simultaneously investigate cell death alongside immunophenotyping, intracellular signaling, or cell cycle status.
A meticulous approach to flow cytometry setup is non-negotiable for generating high-quality, publication-ready data in apoptosis research. The process begins with a fundamental understanding of the instrument's optical system and requires careful matching of fluorophores like Annexin V FITC to the appropriate lasers and filters. Adherence to a standardized staining protocol, coupled with the rigorous use of controls for compensation, ensures the accurate discrimination between viable, early apoptotic, and late apoptotic/necrotic cell populations. As the field progresses towards higher-parameter experiments, technologies like spectral flow cytometry will provide even greater power for dissecting the complex biological networks underlying programmed cell death. By applying the principles and protocols outlined in this guide, researchers and drug development professionals can confidently configure their instruments to yield reliable and insightful results.
The quantification of distinct cell populations—viable, early apoptotic, and late apoptotic/necrotic—represents a fundamental technique in cell biology, oncology, and drug discovery research. Flow cytometry-based analysis utilizing Annexin V staining has emerged as the gold standard method for detecting early apoptotic events by measuring the externalization of phosphatidylserine (PS), a phospholipid that translocates from the inner to the outer leaflet of the plasma membrane during apoptosis initiation [1] [49]. This technical guide provides comprehensive methodologies for experimental protocols, data analysis, and gating strategies essential for accurate quantification of apoptotic populations within the broader context of apoptosis research. When integrated with viability dyes such as propidium iodide (PI), this approach enables researchers to discriminate between healthy cells, early apoptotic cells (which expose PS but maintain membrane integrity), and late apoptotic or necrotic cells (which lose membrane integrity) [5] [39]. The precision of this assay depends critically on appropriate experimental design, optimized staining protocols, and systematic gating strategies to ensure reliable quantification of cellular responses to various therapeutic agents or experimental conditions.
Principles of Annexin V FITC/PI Apoptosis Detection
The fundamental principle underlying Annexin V-based apoptosis detection relies on the specific molecular interactions that occur during programmed cell death. In viable, healthy cells, phosphatidylserine (PS) is predominantly restricted to the inner, cytoplasmic leaflet of the plasma membrane through the activity of specific translocases [1] [49]. During the early stages of apoptosis, this asymmetric distribution is lost, and PS becomes exposed on the external surface of the cell, serving as a definitive "eat-me" signal for phagocytic cells [49]. Annexin V, a 35-36 kDa calcium-dependent phospholipid-binding protein, exhibits high affinity for PS, enabling specific detection of this apoptotic marker when conjugated to fluorochromes such as FITC [1] [60].
The discrimination between early and late apoptotic stages is achieved through simultaneous staining with a membrane-impermeant DNA-binding dye such as propidium iodide (PI). PI is excluded from viable cells and early apoptotic cells with intact plasma membranes but penetrates late apoptotic and necrotic cells with compromised membrane integrity, staining nuclear DNA [5] [39]. This differential staining pattern allows for clear resolution of four distinct cell populations, as summarized in Table 1.
Table 1: Definition of Cell Populations Based on Annexin V-FITC and Propidium Iodide Staining
| Cell Population | Annexin V-FITC | Propidium Iodide | Cellular State |
|---|---|---|---|
| Viable/Normal | Negative | Negative | Healthy, intact membrane |
| Early Apoptotic | Positive | Negative | PS externalization, membrane intact |
| Late Apoptotic | Positive | Positive | PS externalization, membrane compromised |
| Necrotic | Negative | Positive | Loss of membrane integrity without PS exposure |
It is crucial to note that the Annexin V-PS interaction is calcium-dependent, requiring the presence of Ca²⁺ in the binding buffer for optimal detection [47]. Conversely, chelating agents such as EDTA, commonly found in trypsinization reagents, must be avoided as they inhibit Annexin V binding and can compromise assay results [61] [47].
Experimental Workflow for Annexin V Staining
The following section outlines comprehensive protocols for the detection of apoptosis using Annexin V-FITC in combination with PI, incorporating critical control samples and optimization steps essential for generating reliable, reproducible data.
Cell Preparation and Staining Protocol
The initial steps of cell preparation significantly impact staining quality and subsequent analysis. For adherent cells, gentle detachment is critical to prevent mechanical induction of apoptosis or membrane damage that could lead to false-positive staining.
Cell Harvesting: Collect both adherent and floating cells, as the latter may contain significant populations of apoptotic cells [5]. For adherent cells, use gentle, EDTA-free dissociation enzymes such as Accutase to minimize damage to the phospholipid membrane [61]. Avoid over-trypsinization, which can artificially expose PS and compromise results.
Cell Washing: Wash harvested cells twice with cold phosphate-buffered saline (PBS) and centrifuge at 300-500 × g for 5 minutes at room temperature [5] [39]. After the final wash, resuspend the cell pellet in 1X Annexin V binding buffer at a density of 1-5 × 10⁶ cells/mL [47].
Staining Setup: Aliquot 100 μL of cell suspension (approximately 1-5 × 10⁵ cells) into staining tubes. For experimental samples, add 5 μL of Annexin V-FITC and 5 μL of propidium iodide (typically at 1 μg/mL) [1] [39]. Mix gently and incubate for 10-15 minutes at room temperature in the dark to prevent fluorochrome photobleaching [47].
Critical Controls: Prepare the following compensation controls from treated cells (or untreated cells if chemically induced apoptosis is being studied) [61] [39]:
- Unstained control: Cells in binding buffer only, for adjusting flow cytometry parameters and detecting autofluorescence.
- Annexin V-FITC single-stain control: For compensating FITC spillover into the PI channel.
- PI single-stain control: For compensating PI spillover into the FITC channel.
Flow Cytometry Analysis: Analyze samples immediately (within 1 hour is recommended) using a flow cytometer equipped with a 488 nm laser [61] [1]. Do not wash cells after PI addition, as this would remove the viability dye [47]. Acquire at least 10,000 events per sample to ensure statistical reliability [39].
Experimental Workflow Diagram
The following diagram illustrates the complete experimental workflow from cell preparation to data analysis:
Figure 1: Experimental Workflow for Annexin V-FITC/PI Apoptosis Assay
Critical Gating Strategy for Apoptotic Population Resolution
Appropriate gating represents perhaps the most critical aspect of data analysis in Annexin V-based apoptosis assays. The following systematic approach enables accurate discrimination of apoptotic populations while excluding debris that could otherwise skew quantification.
Three-Step Gating Methodology
A refined three-step gating strategy effectively eliminates debris from the final analysis, preventing inflation of the viable cell population with non-cellular particles [62]:
Step 1: Initial Fluorescence Gating
- Display the entire, ungated dataset on an Annexin V-FITC versus PI dot plot.
- Draw a region (R1) around the double-negative population (Annexin V-FITC negative/PI negative), which represents the most viable cell fraction.
Step 2: Debris Identification
- Apply gate R1 to a forward scatter (FSC) versus side scatter (SSC) dot plot.
- Draw a tight region (R2) around the population with low FSC characteristics, identified as debris. This population typically appears as a distinct cluster with lower FSC compared to the main viable cell population.
Step 3: Debris Exclusion
- Invert the debris gate (R2) to create a "Not-Debris" gate.
- Apply this "Not-Debris" gate to the total population for the final Annexin V versus PI analysis and quadrant placement.
This method specifically gates out events that are small and have no fluorescence, which constitutes an appropriate definition of debris. Importantly, this approach does not simply exclude all small events, as some small apoptotic or necrotic cells with fluorescence should be included in the analysis [62].
Gating Strategy Diagram
The following diagram illustrates the sequential gating strategy for accurate apoptosis analysis:
Figure 2: Sequential Gating Strategy for Apoptosis Analysis
Population Quantification and Interpretation
After applying the appropriate gating strategy, quantification of the four distinct populations follows standard quadrant analysis:
- Lower Left Quadrant (Annexin V-FITC⁻/PI⁻): Viable, healthy cells that exclude both stains.
- Lower Right Quadrant (Annexin V-FITC⁺/PI⁻): Early apoptotic cells with externalized PS but intact membranes that exclude PI.
- Upper Right Quadrant (Annexin V-FITC⁺/PI⁺): Late apoptotic cells with externalized PS and compromised membranes.
- Upper Left Quadrant (Annexin V-FITC⁻/PI⁺): Typically represents necrotic cells or cells that have suffered severe membrane damage without PS externalization; may also contain cellular debris or artifacts.
When reporting results, it is essential to include the percentage of debris excluded in the initial gating step, as significant variations in debris between treatment conditions may provide additional biological insights [62].
Comprehensive Troubleshooting Guide
Even with optimized protocols, researchers may encounter challenges in Annexin V-based apoptosis assays. The following table addresses common issues and provides evidence-based solutions.
Table 2: Troubleshooting Common Issues in Annexin V Apoptosis Assays
| Problem | Potential Causes | Recommended Solutions |
|---|---|---|
| High Background in Controls | Poor compensation causing fluorescence overlap [61] | Use single-stain controls to properly adjust compensation [61] [39] |
| Cell autofluorescence interference [61] | Choose a kit with non-overlapping fluorophores (e.g., PE, APC instead of FITC) [61] | |
| No Positive Signal in Treated Group | Insufficient drug concentration or treatment duration [61] | Optimize treatment conditions with concentration and time gradients [61] |
| Apoptotic cells lost in supernatant [61] | Always collect both adherent and floating cells during harvesting [5] | |
| Only PI Positive, Annexin V Negative | Excessive mechanical damage during processing [61] | Use gentle pipetting; avoid vortexing; use EDTA-free dissociation enzymes [61] |
| Only Annexin V Positive, PI Negative | Early apoptosis stage only reached [61] | Extend treatment duration; include positive control to verify kit functionality [61] |
| PI dye omitted from staining protocol [61] | Confirm all staining reagents are added according to protocol [1] | |
| Poor Population Separation | Spectral overlap between fluorophores [61] | Optimize compensation; verify filter configuration on flow cytometer [39] |
| Calcium chelators in buffer [61] [47] | Use calcium-containing binding buffer; avoid EDTA-containing solutions [47] |
Research Reagent Solutions Toolkit
Successful implementation of Annexin V apoptosis assays requires specific reagents and materials optimized for this application. The following table summarizes essential components and their functions.
Table 3: Essential Research Reagents for Annexin V Apoptosis Detection
| Reagent/Category | Function & Purpose | Selection Considerations |
|---|---|---|
| Annexin V Conjugates | Binds externalized PS on apoptotic cells | Choose fluorochrome based on flow cytometer configuration and other markers: FITC, PE, APC, Alexa Fluor dyes [47] [49] |
| Viability Dyes | Identifies membrane-compromised cells | Propidium iodide (PI), 7-AAD, or fixable viability dyes (eFluor lines) [47] [49] |
| Binding Buffer | Provides calcium for Annexin V-PS binding | Must contain Ca²⁺; avoid EDTA contamination; available as 5X or 10X concentrates [47] |
| Cell Dissociation Reagents | Gentle detachment of adherent cells | Use EDTA-free enzymes such as Accutase to prevent calcium chelation [61] |
| Compensation Controls | Correct for spectral overlap in flow cytometry | Required: unstained, single-stain Annexin V, single-stain viability dye [61] [39] |
| Positive Control | Verifies assay functionality | Camptothecin (10 µM, 4 hours) induces apoptosis in Jurkat cells [49] |
Advanced Applications and Multiparametric Analysis
The basic Annexin V assay can be extended to incorporate additional parameters for more comprehensive biological insights. Advanced applications include:
Simultaneous Surface Marker Analysis: Combining Annexin V/PI staining with fluorochrome-conjugated antibodies enables tracking of protein expression changes in specific cell subpopulations during apoptosis. For example, APC-conjugated antibodies against markers like CD44 and CD24 can be integrated to study apoptosis in cancer stem cell populations [39].
Fixable Viability Dyes (FVDs): When subsequent intracellular staining is required, FVDs can replace PI as they remain stable after fixation, allowing for discrimination of live/dead cells prior to permeabilization [47].
Mechanistic Studies: Annexin V staining can be combined with probes for mitochondrial membrane potential (e.g., MitoTracker Red) or caspase activity assays to provide insights into the specific apoptotic pathways activated under experimental conditions [49].
These multiparametric approaches require careful panel design, including spectral overlap consideration, appropriate compensation controls, and sequential gating strategies to resolve complex cellular populations.
Accurate quantification of viable, early, and late apoptotic populations through Annexin V-based flow cytometry requires meticulous attention to experimental design, staining protocols, and data analysis strategies. The gating methodology presented in this guide, specifically addressing debris exclusion, enables researchers to obtain reliable, reproducible quantification of apoptotic populations. Furthermore, comprehensive troubleshooting approaches facilitate the identification and resolution of common technical challenges. When properly executed, Annexin V/PI apoptosis assays provide robust, quantitative data essential for therapeutic development, toxicology studies, and basic research into cell death mechanisms. The techniques outlined herein establish a foundation for standardized apoptosis assessment that can be adapted and expanded to address diverse research questions across biological disciplines.
The study of programmed cell death, or apoptosis, is a cornerstone of biological research, particularly in the fields of oncology, immunology, and drug development. Among the various techniques available for detecting apoptosis, the Annexin V FITC assay has emerged as a fundamental tool due to its ability to identify early apoptotic events. The principle of this assay is based on the specific binding of Annexin V, a 35-36 kDa calcium-dependent phospholipid-binding protein, to phosphatidylserine (PS) [49]. In viable, healthy cells, PS is predominantly located on the inner leaflet of the plasma membrane. However, during the early stages of apoptosis, cells lose membrane asymmetry and PS is translocated to the outer leaflet, where it becomes accessible for binding by Annexin V [1]. When conjugated to fluorescein isothiocyanate (FITC), this binding provides a sensitive method for detecting apoptotic cells via flow cytometry.
The integration of Annexin V-based apoptosis detection with other cellular analyses represents a significant advancement in cytometry, allowing researchers to obtain a more comprehensive understanding of cellular responses to various stimuli. Multiparametric flow cytometry enables the simultaneous assessment of multiple cellular parameters, providing insights into the interconnected nature of cell death, proliferation, and cell cycle dynamics [63]. This technical guide explores the principles, methodologies, and applications of integrating Annexin V FITC apoptosis detection with proliferation and cell cycle analysis, offering researchers a robust framework for comprehensive cellular assessment.
Integrated Multiparametric Assay Principles
Theoretical Foundation for Parameter Integration
The integration of apoptosis detection with proliferation and cell cycle analysis is predicated on the biological interdependence of these processes. Cell population dynamics are fundamentally governed by the balance between cell proliferation and cell death, with both processes being influenced by cell cycle progression and mitochondrial function [63]. For instance, mitochondrial depolarization can trigger the intrinsic apoptosis pathway through the release of cytochrome c, while also impairing energy production necessary for cell cycle progression [63]. Similarly, cell cycle arrest at specific checkpoints can either precede apoptosis or alter cellular susceptibility to apoptotic stimuli.
The methodological synergy between these assays allows researchers to distinguish whether observed changes in cell numbers result from altered proliferation rates or increased cell death, while simultaneously providing mechanistic insights into the underlying causes [63]. This integrated approach is particularly valuable in pharmacological screenings and mechanistic studies, where understanding the precise mode of action of therapeutic compounds is essential.
Staining Principles and Compatibility
Successful multiparametric analysis requires careful consideration of the staining principles and compatibility of various probes:
Annexin V/Propidium Iodide (PI) Staining: This combination allows discrimination between viable cells (Annexin V−/PI−), early apoptotic cells (Annexin V+/PI−), late apoptotic cells (Annexin V+/PI+), and necrotic cells (Annexin V−/PI+) [63] [1]. The calcium-dependent binding of Annexin V to externalized PS identifies early apoptotic events, while PI penetration indicates loss of membrane integrity.
BrdU/PI Staining for Cell Cycle Analysis: Bromodeoxyuridine (BrdU), a thymidine analog, is incorporated during DNA synthesis, specifically labeling S-phase cells [63]. Simultaneous staining with PI, which binds stoichiometrically to DNA, enables discrimination of cells in G1 (2N DNA content), S (intermediate DNA content), and G2/M (4N DNA content) phases of the cell cycle.
CellTrace Violet Staining for Proliferation: This fluorescent dye dilution assay tracks cell divisions over time. As cells divide, the dye is equally partitioned between daughter cells, resulting in a sequential halving of fluorescence intensity with each generation [63].
JC-1 Staining for Mitochondrial Membrane Potential: The JC-1 dye exhibits potential-dependent accumulation in mitochondria, indicated by a fluorescence emission shift from green (~529 nm) to red (~590 nm) as the mitochondrial membrane potential increases [63]. This allows quantification of mitochondrial depolarization, an early event in apoptosis.
The combination of these staining techniques enables the collection of comprehensive data on DNA synthesis intensity, cell cycle status, mitochondrial membrane potential, and both early and late apoptosis from a single sample [63].
Experimental Design and Workflow
Integrated Staining Protocol
The following protocol, adapted from a recently published methodology, enables the assessment of multiple cellular parameters from a single sample of approximately half a million cells within approximately 5 hours [63]:
Sample Preparation:
- Culture cells under appropriate conditions and apply experimental treatments.
- For proliferation tracking, incubate cells with CellTrace Violet according to manufacturer's instructions prior to treatment.
- For S-phase detection, pulse-label cells with BrdU (10-20 µM) for 30-60 minutes at 37°C at an appropriate time point before harvesting.
Cell Staining Workflow:
- Harvest cells, ensuring gentle dissociation using EDTA-free enzymes like Accutase to preserve membrane integrity [61].
- Wash cells with azide-free, protein-free PBS and resuspend at 1-10×10⁶ cells/mL.
- Stain with Fixable Viability Dye (e.g., FVD eFluor 660, 506, or 780) in PBS for 30 minutes at 2-8°C, protected from light.
- Wash twice with Flow Cytometry Staining Buffer.
- Stain surface antigens if required (following standard protocols).
- Wash cells once with 1X Annexin V Binding Buffer.
- Resuspend cells in 1X Annexin V Binding Buffer at 1-5×10⁶ cells/mL.
- Add fluorochrome-conjugated Annexin V (5 µL per 100 µL cell suspension) and incubate 10-15 minutes at room temperature, protected from light.
- Add 2 mL 1X Binding Buffer, centrifuge, and resuspend in 200 µL 1X Binding Buffer.
- Add PI or 7-AAD and analyze immediately by flow cytometry.
Note: Do not wash cells after adding PI or 7-AAD, as these dyes must remain in the buffer during acquisition [64].
Critical Considerations:
- Maintain calcium-containing buffers throughout Annexin V staining, as EDTA or other calcium chelators will interfere with Annexin V binding [61] [64].
- Include appropriate controls: unstained cells, single-stain controls for compensation, and treatment controls.
- Analyze samples within 4 hours of staining for optimal viability assessment.
- For intracellular staining (BrdU), cells must be fixed and permeabilized after surface staining and Annexin V detection.
Experimental Workflow Visualization
The following diagram illustrates the sequential steps in the integrated multiparametric analysis workflow:
Data Analysis and Interpretation
Gating Strategy and Population Discrimination
A systematic gating strategy is essential for accurate interpretation of multiparametric flow cytometry data:
- Forward Scatter (FSC) vs Side Scatter (SSC): Begin by gating on the main cell population, excluding debris and cell aggregates.
- Viability Dye vs SSC: Select viability dye-negative cells to focus on live and early apoptotic populations.
- Annexin V vs PI: Identify viable (Annexin V−/PI−), early apoptotic (Annexin V+/PI−), late apoptotic (Annexin V+/PI+), and necrotic (Annexin V−/PI+) populations.
- CellTrace Violet Analysis: For proliferation assessment, analyze dye dilution patterns in the viable cell population.
- BrdU/DNA Content Analysis: For cell cycle assessment, create bivariate plots of BrdU incorporation versus DNA content (PI staining) to distinguish G1, S, and G2/M phases.
Data Interpretation Framework
The following diagram illustrates the logical relationship between the measured parameters and their biological significance in the integrated analysis:
Research Reagent Solutions
The following table details essential reagents and their functions in integrated apoptosis, proliferation, and cell cycle analysis:
| Research Reagent | Function in Multiparametric Analysis | Key Considerations |
|---|---|---|
| Annexin V Conjugates (FITC, PE, APC, Alexa Fluor) | Detection of phosphatidylserine externalization during early apoptosis [49] | Calcium-dependent binding; avoid EDTA-containing buffers [61] [64] |
| Viability Dyes (PI, 7-AAD, Fixable Viability Dyes) | Discrimination of membrane-intact vs. membrane-compromised cells [49] [64] | PI/7-AAD must not be washed out after staining [64] |
| CellTrace Violet | Tracking cell division history and proliferation rates [63] | Equal distribution between daughter cells with each division |
| BrdU | Identification of S-phase cells through DNA incorporation [63] | Requires DNA denaturation and specific antibody detection |
| JC-1 Dye | Assessment of mitochondrial membrane potential [63] | Exhibits potential-dependent emission shift (green→red) |
| CDK Inhibitors (e.g., Roscovitine) | Experimental control for cell cycle arrest [63] | Induces G1 phase accumulation |
| Apoptosis Inducers (e.g., Campothecin, Staurosporine) | Positive controls for apoptosis induction [49] [65] | Campothecin (10 μM, 4 hours) effectively induces apoptosis |
Quantitative Data from Integrated Analysis
The following table summarizes typical experimental results from integrated multiparametric analysis of cellular responses to different treatments:
| Treatment Condition | Viable Cells (%) | Early Apoptotic (%) | Late Apoptotic (%) | G1 Phase (%) | S Phase (%) | G2/M Phase (%) | Proliferation Index |
|---|---|---|---|---|---|---|---|
| Control (Untreated) | 85-95% | 2-5% | 1-3% | 45-55% | 30-40% | 10-15% | 1.0 (Reference) |
| Cell Cycle Inhibitor (e.g., Roscovitine) | 70-80% | 10-15% | 5-10% | 60-70% | 15-25% | 8-12% | 0.6-0.8 |
| Apoptosis Inducer (e.g., Campothecin) | 40-60% | 20-30% | 15-25% | 35-45% | 25-35% | 15-20% | 0.7-0.9 |
| Metabolic Stress (e.g., Glutamine Deprivation) | 50-70% | 15-25% | 10-20% | 50-60% | 20-30% | 10-15% | 0.5-0.7 |
Note: The values presented are representative ranges observed in various cell lines under different treatment conditions and may vary depending on specific experimental parameters [63] [66] [65].
Troubleshooting and Technical Considerations
Common Challenges and Solutions
- High Background in Annexin V Staining: This may result from mechanical damage during cell harvesting. Use gentle, EDTA-free dissociation enzymes like Accutase instead of trypsin-EDTA [61].
- Weak Proliferation Signals: Ensure CellTrace Violet concentration is optimized for specific cell type and that dye hasn't degraded due to improper storage.
- Poor Cell Cycle Resolution: Check PI concentration and ensure thorough RNAse treatment to eliminate RNA binding.
- Fluorescence Compensation Issues: Always include single-stain controls for each fluorochrome used [61].
- Rapid Loss of Signal: Analyze samples immediately after staining (within 1-4 hours) as Annexin V binding is reversible and cell viability decreases over time [61] [64].
Methodological Limitations
While integrated multiparametric analysis provides comprehensive data, several limitations should be considered:
- The Annexin V assay cannot distinguish between apoptosis and other forms of PS-exposing cell death, such as necroptosis [1].
- Fixation procedures may affect antigen accessibility and protein function.
- Spectral overlap between fluorochromes can limit the number of simultaneously detectable parameters.
- The technique requires specialized flow cytometry equipment with multiple laser lines and detectors.
Advanced Applications and Future Directions
The integration of apoptosis detection with proliferation and cell cycle analysis has enabled significant advances in numerous research areas. In cancer research, this approach has been used to evaluate the chemopreventive potential of natural compounds, such as lyophilized mango pulp extract, which was shown to induce cell cycle arrest in the G2/M phase and increase Annexin V-positive staining in human colon cancer cells [66]. Similar methodologies have been applied to study the effects of metabolic inhibitors on mitochondrial function and cell cycle progression, revealing that Complex III inhibition can trigger S-phase accumulation linked to disrupted nucleotide biosynthesis [63].
Emerging technologies continue to expand the capabilities of multiparametric analysis. Recent developments include shortwave-infrared (SWIR) emitting Annexin V probes, which enable high-contrast molecular imaging of tumor apoptosis in living mice [67]. These advanced probes facilitate long-term monitoring of therapeutic responses in vivo, providing translational opportunities for pre-clinical drug development.
Future methodological expansions may incorporate additional parameters such as caspase-specific fluorescent probes for earlier apoptosis detection, γH2AX staining for DNA damage assessment, and dyes for measuring reactive oxygen species production [63]. These advancements will further enhance our ability to decipher complex cellular responses to pharmacological treatments and genetic manipulations, solidifying the role of integrated multiparametric analysis as an essential tool in biomedical research.
Solving Common Problems: An Annexin V Assay Troubleshooting Guide
In the study of programmed cell death, the Annexin V FITC assay stands as a cornerstone technique for detecting early apoptosis through its specific binding to externalized phosphatidylserine (PS). However, the unexpected appearance of apoptotic cells in negative control groups—a phenomenon known as spontaneous apoptosis—presents a significant challenge to experimental validity, particularly in the context of pharmaceutical development and basic apoptosis research. This technical guide examines the root causes of spontaneous apoptosis in control samples and provides evidence-based methodologies to mitigate these false-positive results. Within the broader framework of Annexin V FITC principle research, addressing these artifacts is paramount for ensuring data accuracy and reproducibility, especially when evaluating novel therapeutic compounds or precise molecular mechanisms of cell death. The following sections delineate the primary sources of this technical artifact, present optimized protocols for its prevention, and introduce advanced modifications to traditional assays to enhance specificity.
Core Mechanisms and Common Causes of Spontaneous Apoptosis
Spontaneous apoptosis in control samples typically arises from suboptimal cell handling, inappropriate assay conditions, or inherent cellular properties. Understanding these triggers is the first step in developing effective countermeasures.
Physical and Mechanical Stress on Cells: Excessive mechanical force during sample preparation is a prevalent cause of false-positive apoptosis signals. Vigorous pipetting, over-trypsinization, or harsh centrifugation can directly damage the plasma membrane or induce early apoptotic pathways, leading to PS externalization in the absence of the experimental apoptotic stimulus [61] [68]. This is especially critical for primary cells, which are often more sensitive to mechanical manipulation than immortalized cell lines.
Enzymatic Detachment and EDTA Use: For adherent cell cultures, the method of cell detachment is a critical factor. The use of trypsin containing EDTA is problematic because the Annexin V binding to PS is a Ca²⁺-dependent process. EDTA, a chelating agent, binds and removes calcium ions from the buffer, thereby interfering with the Annexin V-PS interaction and compromising assay results [61]. Furthermore, over-digestion with trypsin can itself provoke apoptosis. To mitigate this, researchers should use gentle, EDTA-free dissociation enzymes like Accutase and limit digestion time [61] [68].
Poor Cell Culture Health and Handling: The overall health of the cell culture prior to experimentation is fundamental. Cells that are over-confluent, starved, or have undergone excessive passaging are prone to spontaneous apoptosis [61]. Maintaining cells in a healthy, logarithmic growth phase and ensuring optimal culture conditions (e.g., fresh medium, proper split ratios) are essential to minimize baseline apoptosis. Additionally, researchers must not discard the cell culture supernatant during harvesting, as apoptotic cells often detach and float, and their exclusion will lead to an underestimation of cell death [61].
Assay Condition Artifacts: Several aspects of the assay procedure itself can introduce artifacts. A primary concern is the potential for false-positive PI staining. Propidium iodide (PI) can bind to RNA within the cytoplasmic compartment, leading to a false signal that misclassifies a viable cell as late apoptotic or necrotic. This issue is particularly pronounced in large cells with high RNA content and can account for up to 40% of positive events in conventional protocols [40]. Delayed analysis post-staining (typically beyond 1 hour) can also lead to deteriorated sample integrity and increased background signal [61].
The diagram below illustrates how these primary causes lead to spontaneous apoptosis and the corresponding points of intervention.
Quantitative Impact and Artifact Identification
Accurately identifying and quantifying the contribution of various factors to spontaneous apoptosis is crucial for troubleshooting. The following table summarizes common artifacts, their observable effects, and recommended detection strategies.
Table 1: Common Artifacts Leading to False Positives and Their Identification
| Artifact Source | Impact on Apoptosis Assay | Recommended Detection Method |
|---|---|---|
| Cytoplasmic PI Staining [40] | False classification of viable cells as late apoptotic/necrotic (up to 40% false positives). | Nuclear co-localization stain (e.g., DRAQ5); RNase A treatment. |
| EDTA in Trypsin [61] [68] | Inhibition of Annexin V binding, leading to underestimation of apoptosis. | Use of EDTA-free dissociation agents; verification with Ca²⁺-containing buffer. |
| Mechanical Stress [61] [68] | Increased Annexin V-positive cells in control groups. | Microscopic inspection for cell debris; comparison of gentle vs. standard pipetting. |
| Unhealthy Cell Culture [61] | Elevated baseline apoptosis across all samples. | Monitor morphology, doubling time, and viability before assay. |
| Autofluorescence [61] | Spectral overlap causing false-positive signal. | Unstained control to establish autofluorescence levels. |
A critical analytical challenge is distinguishing true apoptosis from other forms of cell death. Researchers must be aware that a sub-G1 DNA content, often used as an apoptosis marker, is not specific and can also be present in necrotic cells and cellular fragments [69]. Similarly, the loss of mitochondrial membrane potential occurs in both apoptotic and necrotic cells and should not be used as a standalone indicator of apoptosis without confirmation of membrane integrity [69]. These limitations underscore the necessity of using Annexin V in combination with other viability markers and morphological assessments.
Optimized Experimental Design and Protocols
A rigorously designed experiment with appropriate controls is the most powerful tool for preventing and identifying spontaneous apoptosis. The following protocol and reagent solutions have been specifically curated to address this issue.
Essential Research Reagent Solutions
Table 2: Key Reagents for Mitigating Spontaneous Apoptosis
| Reagent / Material | Function / Purpose | Key Consideration |
|---|---|---|
| EDTA-Free Dissociation Enzyme (e.g., Accutase) [61] [68] | Gentle detachment of adherent cells while preserving membrane integrity and Ca²⁺-dependent staining. | Preferable to trypsin-EDTA; requires optimization of incubation time. |
| Annexin V Binding Buffer (with Ca²⁺) [49] [68] | Provides the necessary calcium ions for specific Annexin V-phosphatidylserine interaction. | Always use freshly prepared or properly stored buffer. |
| RNase A [40] | Degrades cytoplasmic RNA to prevent false-positive Propidium Iodide (PI) staining. | Critical for large cells and primary cells with high RNA content. |
| Viability Dyes (PI, 7-AAD, SYTOX Green) [61] [49] | Distinguishes intact (live/early apoptotic) from compromised (late apoptotic/necrotic) membranes. | Must be titrated and used at correct concentration. |
| Fluorophore-Conjugated Annexin V | Detection of externalized phosphatidylserine on the outer leaflet of the plasma membrane. | Choose a fluorophore that does not overlap with cellular autofluorescence or other labels (e.g., GFP). |
Modified Annexin V/PI Apoptosis Assay Protocol with RNase Treatment
This protocol incorporates a critical RNase treatment step to eliminate false-positive PI signals, a major source of artifact in apoptosis assays [40].
Workflow Overview:
Detailed Step-by-Step Instructions:
- Cell Harvesting: Harvest cells using a gentle, EDTA-free dissociation agent like Accutase. Terminate digestion promptly and wash cells gently. Crucially, retain the culture supernatant and pool it with the adherent cells to ensure the collection of any cells that have already detached due to apoptosis [61] [68].
- Washing and Buffering: Centrifuge cells at 335 × g for 10 minutes and decant the supernatant. Resuspend the cell pellet in 1X PBS without calcium or magnesium. Repeat the centrifugation and resuspend the final pellet in 1X Annexin V Binding Buffer at a concentration of 2-4 × 10⁶ cells per 100 µL [40].
- Fluorochrome Staining:
- Add Annexin V conjugate (e.g., Annexin V-FITC) as per the manufacturer's recommendation.
- Incubate for 15 minutes in the dark at room temperature.
- Add a further 100 µL of binding buffer.
- Add PI to a final concentration of 2 µg/mL.
- Incubate for another 15 minutes in the dark [40].
- Fixation and RNase Treatment (Critical Step):
- Add 500 µL of binding buffer and 500 µL of 2% formaldehyde to fix the cells, resulting in a final 1% formaldehyde solution. Fix on ice for 10 minutes.
- Add 1 mL of PBS, centrifuge at 425 × g for 8 minutes, and decant the supernatant. Repeat this wash step.
- Resuspend the pellet and add RNase A to a final concentration of 50 µg/mL. Incubate for 15 minutes at 37°C [40]. This step digests cytoplasmic RNA, which is a primary cause of nonspecific PI staining.
- Final Preparation and Analysis: Add 1 mL of PBS, centrifuge, and decant the supernatant. Resuspend the cells in an appropriate volume of binding buffer for immediate analysis by flow cytometry.
Establishing Rigorous Experimental Controls
Proper controls are non-negotiable for the correct interpretation of Annexin V assays and for diagnosing spontaneous apoptosis. The required controls and their purposes are systematically outlined below.
Table 3: Essential Control Setup for Annexin V Flow Cytometry Experiments
| Control Group | Annexin V | Viability Dye (e.g., PI) | Sample | Primary Purpose |
|---|---|---|---|---|
| Unstained Control | - | - | Untreated Cells | Adjust FSC/SSC and voltage settings; define negative population and autofluorescence. |
| Single-Color Control (Annexin V) | + | - | Apoptotic Cells | Adjust fluorescence compensation and detector settings for the Annexin V channel. |
| Single-Color Control (Viability Dye) | - | + | Apoptotic Cells | Adjust fluorescence compensation and detector settings for the viability dye channel. |
| Biological Negative Control | + | + | Untreated Cells | Determine the baseline level of spontaneous apoptosis; verify assay health. |
Advanced Technical Considerations
Beyond the fundamental protocols, several advanced factors can influence the incidence of spontaneous apoptosis. Researchers should note that cellular autofluorescence or fluorescence from expressed proteins like GFP can interfere with detection. Selecting Annexin V conjugated to fluorophores with non-overlapping emission spectra (e.g., APC instead of FITC for GFP-expressing cells) is essential [61] [49]. Furthermore, certain cell types or treatment conditions can increase nonspecific antibody binding, which can be mistaken for a specific signal; the use of isotype controls is recommended in such scenarios [69].
The phenomenon of spontaneous apoptosis also has biological relevance. Studies have shown that a small proportion of apoptotic cells in therapeutic stem cell preparations can exert significant immunomodulatory effects, a property attributed to the exposed phosphatidylserine [70]. This highlights that not all apoptosis in controls is a mere artifact; in some experimental systems, it may represent a biologically relevant process that must be accounted for in the interpretation of results.
Spontaneous apoptosis in control samples is a multifactorial problem rooted in cell preparation, assay execution, and analytical techniques. By understanding its causes—ranging from mechanical stress and inappropriate trypsinization to cytoplasmic PI staining—and implementing the solutions outlined herein, researchers can significantly enhance the reliability of their apoptosis data. The adoption of gentle, EDTA-free cell harvesting, the integration of an RNase treatment step, and the mandatory use of a full panel of controls constitute a robust framework for mitigating false positives. As research on apoptosis continues to be critical in drug discovery and basic biology, adhering to these refined technical guidelines will ensure that conclusions drawn from Annexin V-based assays are both accurate and meaningful.
This guide provides a systematic framework for researchers to troubleshoot weak or absent signals in Annexin V FITC-based apoptosis detection assays. Effective resolution requires a methodical approach to diagnose issues related to reagent viability, treatment efficacy, and experimental technique.
Core Principle of Annexin V FITC Apoptosis Detection
The assay is based on the calcium-dependent binding of Annexin V to phosphatidylserine (PS). In healthy cells, PS is restricted to the inner leaflet of the plasma membrane. During early apoptosis, PS is translocated to the outer leaflet, where it becomes accessible for binding by fluorescently conjugated Annexin V (e.g., FITC). A viability dye, typically propidium iodide (PI) or 7-AAD, is used concurrently to distinguish intact early apoptotic cells (Annexin V+/PI-) from late apoptotic and necrotic cells (Annexin V+/PI+) with compromised membranes [61] [71] [1].
Systematic Diagnosis of Signal Issues
Troubleshooting should progress from verifying the cellular response to confirming reagent functionality and ensuring proper experimental execution. The following workflow provides a logical diagnostic path.
I. Investigating Treatment Efficacy and Cellular Response
A lack of signal may originate from an insufficient apoptotic stimulus or failure to capture the entire cell population.
Problem: Inadequate Apoptotic Induction
Even with viable reagents, the signal will be weak if apoptosis has not been effectively induced [61] [72].
Solutions:
- Dose-Response and Kinetic Studies: Apoptosis is a dynamic process. Establish a time course and titrate the inducer (e.g., drug, UV radiation) concentration. The optimal signal may occur at a specific time window post-treatment [61].
- Morphological Confirmation: Use microscopy to observe classic apoptotic morphology like membrane blebbing and cell shrinkage [72].
- Positive Control: Always include a positive control (e.g., cells treated with 0.1-1 µM staurosporine for 2-4 hours or 1 µM camptothecin for 4 hours) to verify that your system can detect apoptosis [61] [73].
Problem: Loss of Apoptotic Cells
A critical and common mistake is the failure to collect all cells, especially those that have detached, which are often the ones undergoing apoptosis [61] [72].
Solutions:
- Harvest All Populations: For adherent cells, carefully collect the culture supernatant containing detached cells before trypsinizing the remaining adherent layer. Pool both populations before staining [61] [72].
- Gentle Handling: Pellet cells at low centrifugal force (e.g., 300 x g for 5 minutes) to avoid losing fragile apoptotic cells [1].
II. Assessing Reagent Viability and Storage
Reagent degradation or improper handling is a primary cause of assay failure.
Reagent Stability and Storage Guidelines
| Reagent | Function | Stability & Storage | Signs of Deterioration |
|---|---|---|---|
| Annexin V-FITC | Binds externalized PS in a Ca2+-dependent manner [71] [1] | Light-sensitive; store at recommended temperature (often 4°C or -20°C); avoid freeze-thaw cycles [71]. | Weak fluorescence, high background [1]. |
| Propidium Iodide (PI) / 7-AAD | Nucleic acid dye; penetrates cells with compromised membranes [61] [73] | PI: Store at 4°C, protected from light [25]. 7-AAD: Must be stored at -20°C [72]. | Loss of nuclear staining signal; failure to distinguish late apoptosis/necrosis [72]. |
| 10X Binding Buffer | Provides optimal Ca2+ concentration and ionic strength for Annexin V binding [73] | Dilute to 1X before use; check for precipitation indicating instability [73] [72]. | Precipitate formation; nonspecific binding or poor Annexin V function [72]. |
Validation Experiments:
- Positive Control Staining: Use a known apoptotic sample to confirm reagent functionality. If the positive control fails, the reagents are likely compromised [61] [73].
- Single-Stain Controls: Perform staining with Annexin V-FITC alone and PI alone on induced cells. This verifies the activity of each reagent and is essential for setting flow cytometry compensation [25] [73].
III. Optimizing Staining Protocols and Experimental Execution
Technical execution errors can significantly impact signal quality.
Critical Experimental Parameters
| Parameter | Common Error | Impact on Signal | Optimal Practice |
|---|---|---|---|
| Cell Handling | Harsh pipetting; over-trypsinization with EDTA-containing trypsin [61] [72]. | Mechanical damage causes false-positive PS exposure and PI uptake [61]. | Use gentle pipetting; use EDTA-free dissociation enzymes like Accutase [61]. |
| Calcium Dependence | Using EDTA-containing buffers (e.g., PBS, trypsin) during or after induction [61] [25]. | Chelates Ca2+, abolishing Ca2+-dependent Annexin V-PS binding [61] [25]. | Use Ca2+-rich 1X Binding Buffer for all staining and washing steps [25] [73]. |
| Staining & Analysis Timeline | Washing cells after adding PI; delayed analysis [25] [71]. | PI is washed out; cell viability declines over time, increasing background [25] [71]. | Do not wash after adding PI; analyze by flow cytometry within 1 hour of staining [25] [73] [71]. |
| Cell Concentration & Antibody Titration | Too many or too few cells; insufficient dye concentration [72]. | Signal saturation; weak fluorescence due to low probe-to-cell ratio [72]. | Use (1-5 \times 10^5) cells in 100 µL buffer with 5 µL Annexin V-FITC [25] [1]. Titrate if signal is weak [72]. |
Problem: Flow Cytometry Instrumentation and Setup
Incorrect instrument configuration can mask a positive signal.
Solutions:
- Threshold Setting: Set the threshold (e.g., on FSC) too high, and apoptotic cells (which are often smaller and have lower FSC) may be excluded from analysis [72].
- Voltage and Compensation: Use unstained and single-stain controls to set photomultiplier tube (PMT) voltages and adjust fluorescence compensation to prevent FITC signal spillover into the PI channel and vice versa [61] [73].
- Gating Strategy: Begin by gating on the intact cell population based on FSC and SSC to exclude debris and dead cells, then analyze fluorescence [43].
Essential Research Reagent Solutions
A successful apoptosis assay relies on a set of core reagents and controls.
| Item | Function & Importance |
|---|---|
| Annexin V-FITC Conjugate | Fluorescent probe for detecting PS externalization on the outer membrane leaflet [71] [1]. |
| Viability Dye (PI or 7-AAD) | Distinguishes early apoptotic (dye-negative) from late apoptotic/necrotic (dye-positive) cells [61] [73]. |
| 10X Annexin V Binding Buffer | Provides the critical calcium and physiological pH required for specific Annexin V-PS interaction [73]. |
| Apoptosis Inducer (Positive Control) | Validates entire experimental system. Examples: Staurosporine, Camptothecin [61] [73]. |
| EDTA-free Cell Dissociation Reagent | Preserves membrane integrity and avoids chelation of Ca2+ needed for Annexin V binding [61]. |
| Viable, Log-phase Cells | Starting with healthy cells minimizes baseline apoptosis and false positives [61] [72]. |
By systematically addressing each component—from the biological response to the chemical reagents and technical execution—researchers can effectively diagnose and resolve the issue of weak or no signal in their Annexin V FITC apoptosis detection assays.
Within the context of annexin V-FITC-based apoptosis research, flow cytometry analysis is frequently confounded by two significant technical challenges: cellular autofluorescence and improper fluorescence compensation. These issues obscure the clear demarcation of cell populations, leading to inaccurate quantification of viable, early apoptotic, late apoptotic, and necrotic cells. Autofluorescence, the inherent light-emitting property of cells, can mimic positive staining signals, while poor compensation causes fluorescent signals to "spill over" into incorrect detectors. This guide provides detailed methodologies and solutions to identify, troubleshoot, and resolve these problems, ensuring the generation of high-quality, publication-ready data in the study of programmed cell death.
Principles of Annexin V-FITC Apoptosis Detection and Common Pitfalls
The annexin V-FITC/propidium iodide (PI) assay is a cornerstone technique for detecting early apoptosis. It operates on the principle that during apoptosis, the membrane phospholipid phosphatidylserine (PS) translocates from the inner to the outer leaflet of the plasma membrane. Fluorescein isothiocyanate (FITC)-conjugated annexin V binds to this externally exposed PS in a calcium-dependent manner, marking early apoptotic cells. Propidium iodide (PI), a DNA-binding dye, is excluded by cells with intact membranes but penetrates cells in late apoptosis or necrosis, where membrane integrity is compromised [61] [1] [71].
The standard interpretation of this dual staining is as follows:
- Viable Cells: Annexin V-FITC⁻/PI⁻
- Early Apoptotic Cells: Annexin V-FITC⁺/PI⁻
- Late Apoptotic Cells: Annexin V-FITC⁺/PI⁺
- Necrotic Cells: Annexin V-FITC⁻/PI⁺
However, autofluorescence and spectral overlap between FITC and PI channels can severely blur these distinctions. Autofluorescence arises from intracellular fluorophores such as flavins and NADPH and can produce a signal that is misinterpreted as weak positive staining [61]. Spectral spillover occurs because the emission spectrum of FITC partially overlaps with the detector for PI, and vice versa. If not corrected through a process called compensation, a cell that is only positive for FITC can appear dimly positive in the PI channel, falsely inflating the late apoptotic or necrotic populations [61] [39].
Troubleshooting Guide: Autofluorescence and Poor Compensation
The table below summarizes the core problems, their impact on data, and recommended solutions.
Table 1: Summary of Common Issues and Solutions
| Problem | Impact on Data | Recommended Solution | Key Experimental Controls |
|---|---|---|---|
| Cellular Autofluorescence [61] | High background signal, reduced signal-to-noise ratio, false positives, and obscured separation between negative and positive populations. | Use annexin V conjugates with brighter fluorophores (e.g., PE, APC) farther in the red spectrum [61]. | Include an unstained control to determine the level of autofluorescence. |
| Poor Fluorescence Compensation [61] [39] | Fluorescence spillover causes populations to appear in incorrect quadrants; for example, FITC-only cells appearing in the PI-positive quadrant. | Use single-stain controls for each fluorophore to set accurate compensation on the flow cytometer [61] [39]. | Prepare single-stain controls (Annexin V-FITC only, PI only) using experimentally treated cells. |
| Poor Cell Population Separation [61] | Inability to clearly distinguish between viable, early, and late apoptotic cells on the dot plot. | Optimize cell health and handling; use gentle, EDTA-free dissociation enzymes like Accutase to prevent PS exposure from mechanical stress [61]. | Include a positive control (e.g., cells treated with a known apoptosis inducer) to validate the assay. |
Experimental Protocols for Mitigation
Protocol: Assessing and Overcoming Autofluorescence
Determine Baseline Autofluorescence:
- Harvest and wash your cell population as usual.
- Resuspend a sample of untreated cells in annexin V binding buffer without adding any fluorescent dyes. This is your unstained control [61] [39].
- Analyze this sample on the flow cytometer using the FITC and PE/PerCP-Cy5-5 (or equivalent) detectors. The signal detected in these channels represents the inherent autofluorescence of your cells.
Select an Alternative Fluorophore:
- If the autofluorescence in the FITC channel is high, switch to an annexin V conjugate labeled with a fluorophore that emits in a longer wavelength region where cellular autofluorescence is typically lower, such as PE, APC, or Alexa Fluor 647 [61].
- Ensure your flow cytometer is equipped with the appropriate lasers and filters to detect these fluorophores.
Staining with Alternative Conjugates:
- Follow the standard annexin V staining protocol provided by the kit manufacturer, but use the alternative conjugate (e.g., Annexin V-APC) instead of Annexin V-FITC.
- Use PI or 7-AAD as the viability dye. Remember to adjust the compensation matrix for the new fluorophore combination using new single-stain controls.
Protocol: Optimizing Fluorescence Compensation
Proper compensation is critical for accurate data interpretation and is a primary solution to the problem of unclear cell populations [61] [39].
Preparation of Single-Stain Controls:
- Induce Apoptosis: Treat a portion of your cells with a known apoptosis inducer (e.g., staurosporine or doxorubicin) to ensure a strong positive signal for your single-stain controls. Using healthy cells for these controls is insufficient [61].
- Annexin V-FITC Single-Stain Control: Harvest the induced cells, wash, and stain with Annexin V-FITC only. Do not add PI.
- PI Single-Stain Control: From the same pool of induced cells, harvest, wash, and stain with PI only. Do not add Annexin V-FITC.
- Unstained Control: Harvest, wash, and resuspend induced cells in binding buffer without any dyes.
Flow Cytometer Setup and Compensation:
- Run the unstained control first. Adjust the voltage for the FITC and PI detectors so that the cell population is positioned in the lower-left quadrant (negative for both signals).
- Run the Annexin V-FITC single-stain control. The population should be bright in the FITC detector but should not shift significantly in the PI detector. Use the compensation software on your cytometer to subtract the FITC signal detected in the PI channel until the median fluorescence of the FITC-positive population in the PI channel matches that of the unstained control.
- Run the PI single-stain control. Similarly, use the compensation software to subtract the PI signal detected in the FITC channel until the median fluorescence is equal to the unstained control.
- Once the compensation matrix is established, it should be applied to all experimental samples acquired during that session.
Diagram 1: Compensation workflow
The Scientist's Toolkit: Essential Reagents and Materials
The following table lists key reagents and their critical functions in performing a robust annexin V apoptosis assay while mitigating technical issues.
Table 2: Key Research Reagent Solutions
| Reagent / Material | Function & Importance | Considerations for Overcoming Challenges |
|---|---|---|
| Annexin V Conjugates (FITC, PE, APC) [61] | Binds externalized phosphatidylserine to detect early apoptosis. | If autofluorescence is high, choose PE or APC over FITC. Ensure the fluorophore is compatible with other markers in the panel. |
| Viability Dye (Propidium Iodide, 7-AAD) [61] [74] | Distinguishes membrane-intact (viable/early apoptotic) from membrane-compromised (late apoptotic/necrotic) cells. | PI and 7-AAD have different emission spectra; 7-AAD may have less spillover into the FITC channel than PI. |
| Calcium-Containing Binding Buffer [1] [71] | Provides the necessary Ca²⁺ for Annexin V to bind to phosphatidylserine. Essential for specific staining. | Always use the buffer provided with the kit or a validated recipe. EDTA-free conditions are mandatory. |
| Gentle Cell Dissociation Reagent (e.g., Accutase) [61] | Detaches adherent cells without damaging the membrane or artificially exposing PS. | Avoid trypsin-EDTA. EDTA chelates calcium, harming binding, and over-trypsinization can cause PS exposure and false positives. |
| Apoptosis Inducer (e.g., Doxorubicin, Staurosporine) [39] | Provides a reliable positive control for assay validation and for setting up compensation. | Use a known effective inducer at a standardized concentration and duration to generate a consistently apoptotic population. |
Integrated Workflow for Clear Apoptosis Analysis
The diagram below outlines a comprehensive experimental strategy, from planning to analysis, designed to preemptively address and correct for autofluorescence and compensation.
Diagram 2: Integrated workflow for clear apoptosis analysis
Successfully navigating the challenges of autofluorescence and poor compensation in annexin V-based apoptosis assays requires a methodical approach grounded in rigorous experimental design. By proactively assessing autofluorescence, selecting appropriate fluorophores, meticulously preparing single-stain controls, and applying precise compensation, researchers can transform unclear, ambiguous flow cytometry data into reliable, high-quality results. Adherence to these protocols ensures accurate differentiation of apoptotic stages, thereby strengthening the validity of conclusions drawn in cell death research and drug development.
In apoptosis research, particularly in studies utilizing sensitive detection methods like the annexin V-FITC assay, ensuring that observed cell death stems from the experimental treatment and not from unintended mechanical or enzymatic damage during handling is paramount. The annexin V-FITC assay is a cornerstone technique for identifying early apoptotic cells by detecting the translocation of phosphatidylserine (PS) from the inner to the outer leaflet of the plasma membrane, a process that requires membrane integrity to distinguish from necrosis [75]. Mechanical and enzymatic stresses from routine laboratory procedures, such as trypsinization and pipetting, can themselves induce membrane damage, phosphatidylserine exposure, and uptake of viability dyes like propidium iodide (PI), thereby confounding experimental results and leading to false positive interpretations of apoptosis [53] [76]. This guide provides an in-depth technical framework for identifying, quantifying, and mitigating these sources of artifact to ensure data integrity in cell-based research and drug development.
Enzymatic Damage from Trypsinization
Trypsin is widely used for cell detachment, but its proteolytic activity is not limited to adhesion proteins. Recent research utilizing terahertz sensing and confocal microscopy has quantified that trypsinization initiates cytoplasmic modification within seconds of exposure [76]. These alterations involve the transfer of small solutes, such as electrolytes and metabolites, across the compromised membrane. The study established a non-linear correlation between the side effects monitored by terahertz sensing and cell height, indicating that morphological changes are a direct consequence of trypsin's impact on cellular integrity, independent of its concentration or exposure time alone [76]. This immediate compromise can predispose cells to exhibit markers of early apoptosis or necrosis if not carefully controlled.
Mechanical Damage from Harsh Handling
Mechanical forces exerted on cells during pipetting, vortexing, or passage through confined spaces can induce significant stress. A 2025 study on SHSY5Y neuroblastoma cells quantified the effects of accelerative forces, finding that axial loading (force applied perpendicular to the culture surface) is significantly more detrimental than lateral loading [77]. The research proposed a threshold of 550 g for axial loading beyond which cells incur irrecoverable damage, whereas cells subjected to lateral loading remained modestly affected even at 1400 g [77]. These forces, transmitted through the culture medium, create fluid dynamics that exert shear and tensile stresses on cells, leading to shape changes (specifically, a transition to a circular morphology) and ultimately, loss of viability [77].
Quantifying Cellular Damage: Key Parameters and Data
Accurate quantification of damage is essential for troubleshooting and optimizing protocols. The following parameters provide a measurable framework for assessment.
Table 1: Quantitative Thresholds for Mechanical and Enzymatic Cell Damage
| Damage Source | Experimental Model | Key Parameter Measured | Damage Threshold | Reference |
|---|---|---|---|---|
| Axial Mechanical Impact | SHSY5Y neuroblastoma cells, 2D culture | Linear Acceleration | > 550 g | [77] |
| Lateral Mechanical Impact | SHSY5Y neuroblastoma cells, 2D culture | Linear Acceleration | ~1400 g (modest effect) | [77] |
| Enzymatic (Trypsin) Exposure | Madin-Darby canine kidney (MDCK) cells | Cytoplasmic Alteration & Cell Volume Change | Onset within seconds | [76] |
Table 2: Morphological and Marker-Based Indicators of Cell Damage
| Indicator Category | Specific Marker/Change | Associated Damage Type | Interpretation in Apoptosis Assays |
|---|---|---|---|
| Morphological | Cell circularity [77] | Mechanical Stress | Indicator of primary injury; may precede apoptosis. |
| Membrane Integrity | Propidium Iodide (PI) uptake [75] [53] | Necrosis / Late-stage Apoptosis | PI+/Annexin V- can indicate necrosis; PI+/Annexin V+ indicates late apoptosis/necrosis. |
| Phospholipid Redistribution | Annexin V-FITC binding [75] [54] | Early Apoptosis / Mechanical Stress | False positives can occur if mechanical damage causes PS exposure. |
The Scientist's Toolkit: Reagents and Technologies for Gentle Cell Handling
Adopting gentler alternatives and leveraging advanced technologies is critical for preserving cell health.
Table 3: Research Reagent Solutions for Apoptosis Detection and Gentle Handling
| Item | Function/Application | Key Features & Considerations |
|---|---|---|
| Annexin V-FITC Apoptosis Kit [75] [53] [54] | Fluorescence-based detection of apoptotic cells via PS externalization. | Must be used with PI to rule out necrosis. Requires Ca2+-dependent binding buffer. |
| Propidium Iodide (PI) [75] [53] | Cell-impermeant DNA dye to identify necrotic/late-stage apoptotic cells. | Distinguishes membrane-compromised cells. Critical for validating Annexin V results. |
| TRAP Chip (Trap-based Recovery After Permeation) [78] | Microfluidic platform for gentle post-migration cell collection. | Avoids high shear forces and enzymatic treatment; enables viable cell recovery for downstream analysis. |
| Non-Enzymatic Cell Dissociation Agents | Alternatives to trypsin for cell detachment. | Minimize proteolytic damage to membrane proteins and cytoskeleton, reducing artifact in apoptosis assays. |
Experimental Protocols for Damage Assessment and Gentle Processing
Basic Protocol: Annexin V-FITC/Propidium Iodide Staining for Flow Cytometry
This protocol allows for the discrimination between viable, early apoptotic, late apoptotic, and necrotic cell populations [75] [54].
- Cell Harvesting: Harvest cells using the gentlest method possible (e.g., non-enzymatic dissociation or low-concentration, short-duration trypsinization neutralized with serum-containing medium).
- Washing: Wash cells once with cold phosphate-buffered saline (PBS) by gentle pipetting. Centrifuge at low g-force (e.g., 300 x g for 5 minutes) to pellet cells.
- Resuspension: Resuspend the cell pellet in pre-diluted 1X Binding Buffer at a density of 2-5 x 10^5 cells/ml [54].
- Staining: Combine 195 µl of cell suspension with 5 µl of Annexin V-FITC conjugate. Mix gently and incubate for 10-15 minutes in the dark at room temperature [75] [54].
- Washing (Optional): Some protocols recommend a subsequent wash with PBS to remove unbound Annexin V-FITC [54].
- Propidium Iodide Addition: Add Propidium Iodide (PI) to a final concentration of 1 µg/ml (e.g., 10 µl of a 20 µg/ml stock to 190 µl of cell suspension) immediately before analysis [54].
- Analysis: Analyze by flow cytometry within 1 hour. Use FITC (FL1) and PI (FL2 or FL3) channels, establishing compensation with single-stained controls.
Alternate Protocol: Gentle Cell Isolation Using the TRAP Chip Microfluidic Platform
For studies involving cell migration, the TRAP chip offers a method to collect cells without harsh mechanical or enzymatic dissociation [78].
- Chip Fabrication: Fabricate the PDMS-based TRAP chip, which features microchannel arrays terminating in a precise "trap region," via replica molding and plasma bonding to a glass substrate [78].
- Cell Seeding and Migration: Seed cells into the device and allow them to undergo confined migration through the microchannels.
- Gentle Recovery: The trap region at the end of each microchannel array facilitates the gentle recovery of viable cells using minimal buffer volumes and low shear stress pipetting, avoiding trypsinization entirely [78].
- Downstream Analysis: Recovered cells maintain viability and are suitable for mechanical characterization (e.g., Young's modulus measurement), protein isolation (western blot), or RNA extraction (qPCR) [78].
Visualizing the Workflow: From Cell Handling to Apoptosis Analysis
The following diagram illustrates the critical decision points in cell handling and their direct impact on the interpretation of an annexin V-FITC apoptosis assay.
Maintaining optimal cell health is not merely a matter of culture condition optimization; it is a critical component of experimental rigor, especially in apoptosis research reliant on the annexin V-FITC principle. By understanding the quantifiable impacts of trypsin and mechanical forces, researchers can make informed decisions to mitigate these confounding factors. The adoption of gentle handling techniques, such as those enabled by microfluidic platforms like the TRAP chip, and the rigorous use of viability dyes like propidium iodide in conjunction with annexin V-FITC, are essential for distinguishing true apoptotic signals from artifacts of cell preparation. Integrating these protocols and checks ensures the generation of reliable, interpretable data, ultimately strengthening the conclusions drawn in mechanistic studies and drug development pipelines.
Integrating Green Fluorescent Protein (GFP)-expressing cell lines with fluorophore-conjugated assays, such as annexin V for detecting apoptosis, presents a common yet complex challenge in modern cell biology research. The annexin V assay operates on the principle of detecting phosphatidylserine (PS) externalization, a hallmark early event in apoptosis where PS translocates from the inner to the outer leaflet of the plasma membrane, creating a binding site for annexin V [49] [1]. When studying apoptosis in the context of GFP-expressing cells—for instance, in transgenic models or transfection reporters—researchers must carefully select alternative fluorophores like PE (Phycoerythrin) or APC (Allophycocyanin) that avoid spectral overlap with GFP while providing high-fidelity data. This technical guide provides a structured framework for selecting compatible fluorophores, designing robust experimental protocols, and implementing advanced tools for accurate apoptosis detection within the specific context of GFP-expressing systems.
Core Principles of Fluorophore Selection and Spectral Compatibility
Understanding Spectral Overlap and Spillover
The fundamental principle in multicolor flow cytometry panel design is managing fluorescence spillover, where a fluorophore's emission is detected in another channel due to spectral overlap [79] [80]. This phenomenon is quantified as spillover spreading, which can significantly compromise data accuracy, particularly in complex panels. When working with GFP-expressing cells, this challenge is amplified, as the GFP signal must be isolated without interference from or to other detection channels.
Brightness is another critical parameter, determined by a fluorophore's extinction coefficient (light absorption capacity) and quantum yield (emission efficiency) [79]. Brightness directly impacts the signal-to-noise ratio, with brighter fluorophores enabling better detection of low-abundance markers. However, excessive brightness can exacerbate spillover issues, necessitating careful balancing in panel design.
The Critical GFP-FITC Conflict
A paramount consideration when working with GFP-expressing cells is the near-complete spectral overlap between enhanced GFP (eGFP) and FITC (Fluorescein Isothiocyanate) [80]. Both molecules exhibit similar excitation (~488 nm) and emission (~510-530 nm) profiles, making them mutually exclusive in the same panel. Since annexin V is commonly conjugated to FITC in apoptosis detection kits [49] [1], researchers must select alternative annexin V conjugates when working with GFP-expressing cells to avoid this unresolvable spectral conflict.
Table 1: Spectral Properties of Common Fluorophores Compatible with GFP-Expressing Cells
| Fluorophore | Excitation Max (nm) | Emission Max (nm) | Relative Brightness | Compatibility with GFP | Recommended Application |
|---|---|---|---|---|---|
| GFP/eGFP | 488 | 507 | High | Self | Transgenic expression reporter |
| PE | 565 | 578 | Very High | High | Annexin V conjugation |
| APC | 650 | 660 | High | High | Annexin V conjugation |
| Alexa Fluor 647 | 650 | 665 | High | High | Annexin V conjugation |
| mTagBFP2 | 399 | 454 | Moderate | High | Secondary reporter |
| PE-Cy7 | 488 | 785 | Bright (Blue laser) | High | Tandem dye for additional parameters |
| APC-Cy7 | 640 | 785 | Dim (Red laser) | High | Tandem dye for additional parameters |
Optimal Fluorophore Pairings with GFP
Based on spectral characteristics, several fluorophores demonstrate excellent compatibility with GFP across common laser lines:
- PE (Phycoerythrin): With excitation maxima at 565 nm and emission at 578 nm, PE is spectrally distant from GFP, minimizing overlap [80]. Its very bright signal makes it ideal for detecting lower-abundance targets.
- APC (Allophycocyanin): Excited at 650 nm and emitting at 660 nm, APC provides exceptional separation from GFP signals and is available as a conjugate for annexin V apoptosis detection kits [49].
- Tandem Dyes: Conjugates like PE-Cy7 and APC-Cy7 utilize FRET technology, where energy transfer creates larger Stokes shifts [79]. These are particularly valuable for expanding panel size while maintaining spectral separation from GFP.
Table 2: Comparison of Annexin V Conjugates for Use with GFP-Expressing Cells
| Annexin V Conjugate | Excitation Laser (nm) | Emission Detection | Compatibility with GFP | Available Kit Formats |
|---|---|---|---|---|
| PE | 488, 532, 561 | 585/42 nm | High | Multiple commercial kits |
| APC | 633-637 | 661/8 nm | High | Multiple commercial kits |
| Alexa Fluor 647 | 633-637 | 661/8 nm | High | Stand-alone reagents |
| Alexa Fluor 555 | 532, 561 | 575/26 nm | Moderate | Stand-alone reagents |
| Pacific Blue | 405 | 450/50 nm | High | Specialized kits |
| eFluor 450 | 405 | 450/50 nm | High | Specialized kits |
Experimental Design and Protocol Integration
Workflow for Apoptosis Detection in GFP-Expressing Cells
The following diagram illustrates the integrated experimental workflow for detecting apoptosis in GFP-expressing cells using spectrally compatible fluorophores:
Step-by-Step Protocol for Annexin V Staining in GFP-Expressing Cells
Materials Required:
- GFP-expressing cell line
- Apoptosis-inducing agent (e.g., camptothecin, staurosporine)
- Annexin V conjugated to PE or APC (avoid FITC)
- Viability dye (e.g., propidium iodide, 7-AAD, SYTOX Green)
- Annexin V binding buffer (1X concentration with Ca²⁺)
- Flow cytometry equipment with appropriate lasers (488 nm for GFP, 561 nm for PE, 633 nm for APC)
Procedure:
- Induction of Apoptosis: Treat GFP-expressing cells with your chosen apoptosis-inducing agent. Include untreated controls as baseline. Common treatments include camptothecin (10 µM for 4 hours) or staurosporine (1 µM for 2-6 hours) [49].
- Cell Harvesting:
- For suspension cells: Collect by gentle centrifugation (300 × g for 5 minutes).
- For adherent cells: Use gentle trypsinization without EDTA, followed by centrifugation and washing with serum-containing media to neutralize trypsin [1].
- Staining Preparation: Resuspend 1-5 × 10⁵ cells in 500 µL of 1X Annexin V binding buffer.
- Fluorophore Addition:
- Add 5 µL of Annexin V conjugated to PE or APC
- Add appropriate volume of viability dye (follow manufacturer's recommendations)
- Incubation: Incubate at room temperature for 5-15 minutes in the dark to prevent photobleaching [1].
- Analysis: Analyze by flow cytometry within 1 hour for optimal results.
Critical Notes:
- Always include single-stained controls (GFP-only, annexin V-only, viability dye-only) for proper compensation.
- Avoid fixation if possible, as it can disrupt membrane integrity and cause artifactual annexin V binding to internal PS [49].
- Process samples immediately after staining, as annexin V binding is reversible.
Advanced Reporter Systems and Detection Strategies
Caspase-Based Apoptosis Reporters
Beyond annexin V staining, innovative fluorescent reporter systems enable real-time monitoring of apoptosis in live cells. These genetically encoded biosensors typically utilize caspase cleavage sites to activate fluorescent signals:
These systems often employ a "split-GFP" architecture where the GFP molecule is divided into two fragments connected by a linker containing the DEVD caspase-3/7 cleavage motif [81]. In non-apoptotic cells, the fragments cannot reassemble, resulting in minimal fluorescence. During apoptosis, caspase-mediated cleavage of the DEVD sequence allows spontaneous GFP reconstitution and fluorescence development [81]. This bright-to-dark (fluorescence loss) or dark-to-bright (fluorescence gain) system provides highly specific, irreversible marking of apoptotic events at single-cell resolution.
Researcher's Toolkit: Essential Reagents and Materials
Table 3: Essential Research Reagent Solutions for Apoptosis Detection in GFP-Expressing Cells
| Reagent/Material | Function/Purpose | Example Products |
|---|---|---|
| Annexin V-PE Conjugate | Binds externalized PS for apoptosis detection without GFP interference | Thermo Fisher Annexin V-PE kits; Abcam ab14155 |
| Annexin V-APC Conjugate | Alternative PS binding conjugate with different spectral characteristics | BioLegend 640941; Thermo Fisher Annexin V-APC |
| Viability Dyes (PI, 7-AAD, SYTOX) | Distinguishes late apoptosis/necrosis by membrane integrity | Propidium Iodide (PI); 7-AAD; SYTOX Green |
| Annexin V Binding Buffer | Provides optimal Ca²⁺ concentration for specific PS binding | 5X or 10X concentrated buffers in commercial kits |
| Caspase-3/7 Fluorescent Reporter | Enables real-time apoptosis monitoring in live cells | ZipGFP-based systems; Caspase-3/7 FRET reporters |
| Apoptosis Inducers (Positive Controls) | Validates assay performance and establishes baselines | Camptothecin; Staurosporine; Carfilzomib |
| Caspase Inhibitors (Negative Controls) | Confirms caspase-dependent apoptosis mechanisms | zVAD-FMK (pan-caspase inhibitor) |
Troubleshooting and Data Interpretation
Common Challenges and Solutions
High Background in GFP Channel:
- Cause: Spillover from improperly selected fluorophores or over-amplification of detectors.
- Solution: Implement careful compensation using single-stained controls. Verify that alternative annexin V conjugates (PE, APC) do not have emission spectra overlapping with the GFP detection filter (typically ~510/20 nm).
Unexpected Annexin V Staining:
- Cause: Membrane damage during cell preparation can allow annexin V access to internal PS.
- Solution: Include viability dye counterstain to discriminate between early apoptotic (annexin V+/viability dye-) and late apoptotic/necrotic (annexin V+/viability dye+) populations [49] [1]. Optimize cell handling to minimize mechanical disruption.
Weak GFP Signal in Transduced Cells:
- Cause: Photobleaching, poor expression, or incorrect laser alignment.
- Solution: Protect samples from light, verify transfection/transduction efficiency, and ensure proper instrument setup with appropriate laser power and detection filters.
Data Analysis and Gating Strategy
When analyzing flow cytometry data from GFP-expressing cells stained with annexin V-PE/APC and a viability dye:
- Initial Gating: Identify cell population based on forward and side scatter to exclude debris.
- GFP Expression: Gate on GFP-positive cells to focus analysis on the transfected/transduced population.
- Viability Assessment: Exclude viability dye-positive cells to focus on early apoptosis or create separate gates for early (annexin V+/viability dye-) and late (annexin V+/viability dye+) apoptotic populations.
- Apoptosis Quantification: Calculate the percentage of annexin V-positive cells within the GFP-positive population.
This structured approach enables specific assessment of apoptosis specifically in the GFP-expressing cell population of interest while maintaining spectral integrity through appropriate fluorophore selection.
Strategic fluorophore selection is paramount for successful integration of GFP-expressing cell systems with apoptosis detection methodologies. The fundamental avoidance of FITC-conjugated annexin V in favor of spectrally distinct alternatives like PE or APC ensures accurate, reliable data collection. By applying the principles of spectral compatibility, implementing appropriate controls, and leveraging advanced reporter technologies, researchers can confidently design robust experiments that yield high-quality insights into cell death mechanisms within genetically modified systems. The frameworks and protocols presented herein provide a comprehensive foundation for optimizing fluorophore panels in the context of GFP-expressing cells while maintaining the integrity of apoptosis detection assays.
The Annexin V FITC assay is a cornerstone technique for detecting early apoptosis by measuring the externalization of phosphatidylserine (PS) on the cell surface. However, the accuracy of this method is critically dependent on the timing of analysis post-staining. Delays can lead to significant signal degradation and artifactual results, compromising data integrity in research and drug development. This technical review synthesizes current evidence to quantify the impact of time on signal accuracy, presents optimized protocols to mitigate these effects, and provides a scientist's toolkit for robust, reproducible apoptosis detection. The findings underscore the necessity of standardized kinetic analysis to uphold the validity of conclusions drawn from Annexin V-based assays.
Within the broader thesis of Annexin V FITC principle for apoptosis research, the temporal variable emerges as a pivotal, yet often underestimated, factor. Apoptosis is a dynamic and rapid process; its accurate detection via Annexin V binding is fundamentally a snapshot of a moving target [82]. The assay relies on the calcium-dependent binding of Annexin V-FITC to phosphatidylserine (PS), a phospholipid that translocates from the inner to the outer leaflet of the plasma membrane during early apoptosis [83] [1]. The integrity of this signal is not static. Post-staining cellular metabolism, the ongoing progression of cell death, and the photochemical stability of fluorochromes are all time-sensitive processes that interact from the moment staining is complete.
This guide delves into the core technical challenges that analysis delay poses to signal accuracy. We explore how delays can artificially inflate populations of late apoptotic and necrotic cells, obscure the true kinetics of cell death in response to stimuli, and ultimately lead to flawed data interpretation. By integrating quantitative studies, detailed methodologies, and evidence-based best practices, this document aims to equip researchers with the knowledge to design and execute Annexin V experiments that are not only methodologically sound but also temporally precise.
The Critical Role of Timing in Annexin V FITC Assays
The imperative for prompt analysis following Annexin V staining is rooted in both the biology of apoptosis and the biochemistry of the detection reagents. The transition from early to late apoptosis is characterized by a loss of plasma membrane integrity, which allows viability dyes like propidium iodide (PI) to enter the cell [83]. An analysis delay provides a larger window for this progression to occur ex vivo, meaning that a cell which was correctly identified as early apoptotic (Annexin V+/PI-) at the time of staining may have progressed to late apoptosis (Annexin V+/PI+) by the time it is analyzed by flow cytometry. This leads to an overestimation of late-stage cell death and a concomitant underestimation of the early apoptotic population, thereby distorting the experimental results.
Furthermore, the health of the cells during the analysis period is not guaranteed. Cells, particularly those under stress from apoptosis-inducing treatments, are metabolically active. Holding them in binding buffer for extended periods can induce "handling-induced apoptosis" or exacerbate secondary necrosis due to nutrient deprivation and accumulation of waste products [84]. One study directly demonstrated that incubation in traditional Annexin Binding Buffer (ABB) for just a few hours resulted in a twofold increase in basal apoptosis rates in control cells and synergized with pro-apoptotic agents to show an eightfold increase in apoptosis compared to cells maintained in standard culture media [84]. This evidence highlights that the analysis buffer and holding time themselves can become significant experimental variables.
The following table summarizes the key technical risks associated with delayed analysis:
Table 1: Impact of Analysis Delay on Assay Parameters
| Assay Parameter | Impact of Delay | Consequence for Data Accuracy |
|---|---|---|
| Membrane Integrity | Gradual loss over time in apoptotic cells. | Underestimation of early apoptosis (Annexin V+/PI-); overestimation of late apoptosis/necrosis (Annexin V+/PI+). |
| PS Signal Stability | Potential for increased non-specific binding or signal decay. | Inaccurate quantification of total apoptotic population. |
| Cellular Viability | Induction of stress-induced death in healthy cells. | Artificially elevated background levels of apoptosis. |
| Fluorochrome Stability | Possible photobleaching of FITC if not protected from light. | Reduced signal-to-noise ratio. |
Quantitative Data on Time-Dependent Signal Degradation
Empirical evidence firmly establishes the quantitative relationship between analysis delay and signal inaccuracy. A landmark study provides a direct comparison, demonstrating that a high-content live-cell imaging method using Annexin V, which allows for continuous kinetic assessment, is 10-fold more sensitive than traditional endpoint flow cytometry analysis [84]. This profound difference in sensitivity is largely attributed to the mechanical and chemical stress cells endure during harvest, staining, and the wait for flow cytometry analysis, which can destabilize the plasma membrane and promote artifact generation.
The same study provided critical data on the consequences of buffer choice and holding time. They observed that vehicle-treated control cells cultured in standard Annexin Binding Buffer (ABB) demonstrated a 100% increase (twofold) in basal apoptosis rates compared to cells in standard culture medium [84]. When cells were treated with apoptosis inducers like CHX and ABT-737, the effect was magnified, with cells in ABB showing an 800% increase (eightfold) in apoptosis compared to treated cells in standard medium [84]. This indicates that the standard buffers and protocols used in flow cytometry can actively stress cells, and this effect is compounded by time.
The progression of apoptosis itself is kinetic, and endpoint measurements often fail to capture its true dynamics. Research shows that Annexin V positivity markedly precedes the uptake of viability dyes like DRAQ7 and YOYO3 [84]. In one experiment, cells treated with an apoptotic inducer showed clear Annexin V staining within the first few hours, while YOYO3 positivity was negligible before the 8-hour mark [84]. A delay in analysis would thus blur the critical distinction between early and late apoptotic events.
Table 2: Comparative Analysis of Apoptosis Detection Methods and Their Temporal Limitations
| Method | Key Feature | Impact of Analysis Delay | Reported Sensitivity |
|---|---|---|---|
| Traditional Flow Cytometry | Endpoint measurement requiring cell harvesting and processing. | High; cells are exposed to mechanical stress and buffer-induced stress during delays. | Baseline (1x) [84] |
| Kinetic Live-Cell Imaging | Real-time, continuous monitoring of cells in culture plates. | Low; minimal handling, cells remain in familiar environment. | 10-fold higher than flow cytometry [84] |
| Microscopy-Based Assay | Enables morphological context but lower throughput. | Moderate; staining and fixation timing are critical to prevent artifacts. | Varies with protocol [1] |
Optimized Experimental Protocols for Maximum Signal Fidelity
To counter the challenges of timing, protocols must be optimized for speed and minimal cellular stress. The following sections detail revised methodologies for flow cytometry and a superior approach using live-cell imaging.
Revised Flow Cytometry Protocol for Minimal Delay
This protocol is adapted from manufacturer and peer-reviewed sources to emphasize speed and cell health [39] [1] [85].
Materials:
- Annexin V-FITC conjugate
- Propidium Iodide (PI) or 7-AAD viability dye
- 1X Binding Buffer (Calcium-containing, e.g., 10 mM HEPES, 140 mM NaCl, 2.5 mM CaCl₂, pH 7.4)
- Flow Cytometry Staining Buffer (PBS with 1% BSA)
- Ice-cold PBS (without calcium or magnesium)
Procedure:
- Cell Harvesting: Harvest cells gently. For adherent cells, prefer non-enzymatic dissociation methods or use a brief trypsinization neutralized with serum-containing media [1]. Combine supernatant (containing floating cells) with trypsinized cells to capture the entire population [5].
- Washing: Wash cells once with ice-cold PBS and then once with 1X Binding Buffer. Centrifuge at 300–500 x g for 5 minutes at room temperature.
- Staining Solution: Resuspend the cell pellet at a density of 1 x 10⁶ cells/mL in ice-cold 1X Binding Buffer.
- Staining: Transfer 100 µL of cell suspension (1 x 10⁵ cells) to a flow tube. Add 5 µL of Annexin V-FITC and the recommended volume of PI (e.g., 2-5 µL) [85]. Gently vortex to mix.
- Incubation: Incubate for 15 minutes at room temperature in the dark [83] [85]. Do not extend this incubation.
- Immediate Analysis: After incubation, add 400 µL of ice-cold 1X Binding Buffer to the tube and analyze by flow cytometry immediately within 1 hour [85]. Keep samples on ice in the dark while waiting for acquisition.
Critical Controls:
- Unstained cells: For baseline autofluorescence.
- Annexin V-FITC single-stained cells: For compensation.
- PI single-stained cells: For compensation.
- Induced apoptotic cells: For a positive control.
Kinetic Live-Cell Imaging Protocol for Real-Time Analysis
This protocol, derived from PMC5261025, eliminates harvesting and provides superior kinetic data [84].
Materials:
- Recombinant Annexin V conjugated to a fluorophore (e.g., AlexaFluor 488 or 594)
- Cell-impermeable viability dye (e.g., YOYO-3, recommended for its low toxicity and rapid staining in this context)
- Standard cell culture medium (e.g., DMEM, which contains sufficient Ca²⁺ for binding)
Procedure:
- Cell Preparation: Seed cells in a multi-well plate compatible with a live-cell imager. Allow cells to adhere and grow overnight.
- Treatment and Staining: Treat cells with the apoptotic inducer. Directly add recombinant Annexin V (at a concentration as low as 0.25 µg/mL, ~7 nM) and the viability dye (e.g., YOYO-3) to the culture medium [84].
- Kinetic Imaging: Place the plate in the pre-equilibrated live-cell imager. Acquire images automatically at defined intervals (e.g., every 2 hours for 24-48 hours) [84].
- Analysis: Use the imager's software to quantify the fluorescence intensity of Annexin V and the viability dye over time, generating kinetic curves of apoptosis progression for the entire population or at the single-cell level.
Workflow Visualization
The diagram below contrasts the procedural steps and critical timing points of the two major protocols.
The Scientist's Toolkit: Essential Reagents and Materials
The following table lists key reagents and materials required for performing robust Annexin V FITC apoptosis assays, with a focus on ensuring signal stability.
Table 3: Essential Research Reagent Solutions for Annexin V FITC Apoptosis Detection
| Reagent/Material | Function/Description | Critical Considerations for Timing & Stability |
|---|---|---|
| Annexin V-FITC Conjugate | Fluorescently-labeled protein that binds externalized PS. | Must be stored and used according to manufacturer specs; protect from light to prevent photobleaching. |
| Viability Dye (PI/7-AAD) | Membrane-impermeable dye staining DNA in dead cells. | Distinguishes early (dye-negative) from late (dye-positive) apoptosis. |
| Calcium-Enriched Binding Buffer | Provides optimal Ca²⁺ for Annexin V-PS binding. | Avoid buffers with EDTA/chelators. Ice-cold buffer post-staining helps preserve cell state. |
| Fixable Viability Dyes (FVD) | Covalently labels amine groups in dead cells before fixation. | Allows for subsequent intracellular staining; incompatible with some Annexin V kits (e.g., FVD eFluor 450) [47]. |
| Compensation Beads | Antibody-capture beads used for single-color controls. | Essential for setting accurate compensation in multicolor flow cytometry; more stable than cell controls [55]. |
| Live-Cell Imaging Chamber | Environmentally controlled chamber for microscopes. | Maintains 37°C & 5% CO₂ during kinetic imaging, vital for cell health during long experiments. |
Visualizing the Apoptotic Pathway and Detection Principle
The core principle of the Annexin V FITC assay is the detection of a specific molecular event in the intrinsic apoptotic pathway. The following diagram illustrates this pathway and the mechanism of detection, highlighting the temporal "window" that the assay targets.
The accuracy of the Annexin V FITC assay is inextricably linked to the timing of post-staining analysis. As demonstrated, delays introduce significant artifacts, including the misclassification of cell populations and the induction of stress-related death. The quantitative data presented reveals that traditional endpoint flow cytometry, with its inherent delays, can be an order of magnitude less sensitive than kinetic approaches. To ensure signal accuracy, researchers must adhere to stringent protocols that minimize analysis windows, consider the use of real-time live-cell imaging for critical kinetic studies, and be acutely aware of the impact that buffers and handling have on cellular integrity. By treating time as a controlled variable, scientists and drug development professionals can bolster the reliability of their apoptosis data, leading to more valid and reproducible research outcomes.
Beyond Annexin V: Validation and Comparison with Other Cell Death Assays
The accurate detection of programmed cell death is a cornerstone of biomedical research, with particular significance in oncology and drug development. Two predominant methodologies have emerged for identifying apoptotic cells: the Annexin V-FITC assay, which detects early membrane changes, and the TUNEL assay, which identifies late nuclear events. The phosphatidylserine (PS) externalization detected by Annexin V represents one of the earliest measurable indicators of apoptosis, occurring before the loss of membrane integrity [1] [86]. In contrast, the TUNEL assay detects DNA fragmentation, a characteristic event of the later stages of apoptosis that results from caspase-activated DNase activity [87] [88]. Understanding the temporal application and technical capabilities of each method is crucial for researchers designing experiments to evaluate cell death mechanisms, screen potential therapeutic compounds, or investigate fundamental biological processes. This technical guide provides an in-depth comparison of these assays, framed within the context of apoptosis research principles, to enable scientists to select the most appropriate methodology for their specific experimental needs.
Fundamental Principles and Mechanisms
Annexin V-FITC: Detecting Early Membrane Alterations
The Annexin V-FITC assay operates on the principle of detecting the loss of plasma membrane asymmetry, a hallmark early event in apoptosis. In viable cells, the phospholipid phosphatidylserine (PS) is predominantly restricted to the inner (cytoplasmic) leaflet of the plasma membrane through the activity of ATP-dependent translocases [49] [11]. During the early phases of apoptosis, this membrane asymmetry collapses, and PS becomes exposed on the outer leaflet of the membrane, creating a specific "eat-me" signal for phagocytic cells [11]. Annexin V is a 35-36 kDa human protein that binds with high affinity to PS in a calcium-dependent manner [1] [49]. By conjugating Annexin V to the fluorochrome Fluorescein Isothiocyanate (FITC), researchers can visually identify and quantify cells undergoing early apoptosis through flow cytometry or fluorescence microscopy [86].
A critical methodological consideration for the Annexin V assay is the need to distinguish between genuine early apoptotic cells and cells that have lost membrane integrity (necrotic or late apoptotic cells). This is typically achieved by co-staining with a membrane-impermeant dye such as propidium iodide (PI) or 7-AAD [1] [49]. These viability dyes are excluded from viable and early apoptotic cells with intact membranes but penetrate cells with compromised membranes. Consequently, this dual-staining approach enables the discrimination of four distinct populations: viable cells (Annexin V−/PI−), early apoptotic cells (Annexin V+/PI−), late apoptotic cells (Annexin V+/PI+), and necrotic cells (Annexin V−/PI+) [49].
TUNEL Assay: Detecting Late Nuclear DNA Fragmentation
The TUNEL (Terminal deoxynucleotidyl transferase dUTP Nick End Labeling) assay identifies a later event in the apoptotic cascade: the systematic cleavage of nuclear DNA. During the execution phase of apoptosis, endonucleases become activated and cleave DNA between nucleosomes, generating an abundance of DNA fragments with exposed 3'-hydroxyl (3'-OH) ends [87] [88]. The TUNEL assay exploits the enzyme terminal deoxynucleotidyl transferase (TdT), which catalyzes the template-independent addition of deoxynucleotides to the 3'-OH ends of these DNA breaks [87] [89].
The detection strategy involves labeling these incorporated nucleotides with tags. Traditional methods use nucleotides directly conjugated to fluorochromes (e.g., FITC-dUTP) or haptens such as biotin-dUTP or BrdU (5-bromo-2'-deoxyuridine) [87] [89]. The hapten-labeled nucleotides are subsequently detected using enzyme-linked or fluorescence-linked reporter systems. More recent advancements, such as the Click-iT TUNEL assay, utilize alkyne-modified dUTP (EdUTP) that is detected via a copper-catalyzed "click" reaction with a fluorescent azide, offering enhanced specificity and signal-to-noise ratio [87]. This methodology allows for the precise labeling and quantification of cells in the advanced stages of apoptosis, characterized by nuclear condensation and DNA fragmentation [88].
Visualizing the Apoptosis Timeline and Detection Windows
The following diagram illustrates the sequential stages of apoptosis and the corresponding detection windows for Annexin V-FITC and TUNEL assays.
Comparative Technical Specifications
Side-by-Side Assay Comparison
The following table summarizes the core characteristics, advantages, and limitations of the Annexin V-FITC and TUNEL assays to facilitate experimental selection.
Table 1: Comprehensive comparison of Annexin V-FITC and TUNEL assays
| Parameter | Annexin V-FITC Assay | TUNEL Assay |
|---|---|---|
| Primary Detection Target | Externalized Phosphatidylserine (PS) [1] [49] | DNA strand breaks with 3'-OH ends [87] [88] |
| Apoptosis Stage Detected | Early [86] | Late [88] |
| Cellular Compartment | Plasma Membrane [1] | Nucleus [87] |
| Key Reagents | Annexin V-FITC conjugate, Propidium Iodide (PI), Ca²⁺-containing binding buffer [1] [49] | TdT Enzyme, Modified dUTP (e.g., EdUTP, BrdUTP), Detection reagents (azides, antibodies) [87] [89] |
| Time to Result | Rapid (~20 minutes incubation) [1] | Slower (1-2 hours for labeling) [87] |
| Sample Compatibility | Live cells (suspension/adherent); fixation possible post-staining with specific conditions [1] [49] | Fixed and permeabilized cells or tissue sections [87] [89] |
| Key Advantage | Distinguishes early vs. late apoptosis/necrosis with PI; live cell analysis [1] [49] | Highly specific for advanced apoptotic nuclei; compatible with tissue archiving methods (FFPE) [87] [88] |
| Primary Limitation | Cannot distinguish apoptosis from other PS-exposing processes (e.g., necroptosis) [1] [11] | Cannot differentiate apoptosis from necrosis based on DNA fragmentation alone [90] |
| Equipment Needs | Flow cytometer or fluorescence microscope [1] | Flow cytometer, microscope, or brightfield microscope (colorimetric) [87] [89] |
Quantitative Performance Data
Survey data from published research provides insights into the practical application and performance of different TUNEL assay methodologies.
Table 2: Relative popularity of TUNEL assay methods based on survey of 50 research papers (2017)
| TUNEL Method | Usage in Publications | Key Characteristics |
|---|---|---|
| dUTP directly conjugated to FITC | 50% | Faster protocol, fewer steps [89] |
| Biotin-dUTP with Streptavidin-HRP | 15% | Signal amplification, requires endogenous biotin blocking [89] |
| FITC-dUTP with anti-FITC-HRP | 15% | Indirect detection method [89] |
| Digoxygenin-dUTP with anti-digoxygenin | 12% | Flexible detection (fluorescent or enzymatic) [89] |
| Br-dUTP with anti-BrdU antibody | 8% | Potentially brighter signal due to efficient TdT incorporation [89] |
Detailed Experimental Protocols
Annexin V-FITC Staining Protocol for Flow Cytometry
The following section provides a detailed methodology for detecting apoptosis using Annexin V-FITC, adapted from established protocols [1] [49].
Key Research Reagent Solutions:
- Annexin V-FITC conjugate: Fluorescently-labeled protein that binds externalized PS.
- Propidium Iodide (PI) solution: Membrane-impermeant DNA dye for viability assessment.
- 1X Annexin V Binding Buffer: Provides appropriate calcium concentration and pH for optimal Annexin V binding.
- Cell culture treated with apoptosis-inducing agent.
- Phosphate Buffered Saline (PBS): For washing cells.
- Serum-containing media: For neutralizing trypsin.
Procedure:
- Induction and Harvesting: Induce apoptosis in cells (0.5-1 x 10⁶ cells) using the desired stimulus (e.g., chemotherapeutic agent, UV radiation). Collect suspension cells by centrifugation at 300-400 x g for 5-10 minutes. For adherent cells, gently trypsinize using a trypsin-EDTA solution that does not contain PS, which Annexin V can bind to. Neutralize trypsin with serum-containing media and collect cells by centrifugation [1].
- Washing: Resuspend the cell pellet in 1-2 mL of PBS or complete media and centrifuge again. Carefully decant the supernatant. This step removes residual calcium from the media which could cause non-specific binding.
- Staining: Resuspend the cell pellet in 500 µL of 1X Annexin V Binding Buffer. Add 5 µL of Annexin V-FITC conjugate. If distinguishing late apoptosis/necrosis, also add 5 µL of Propidium Iodide (PI) solution [1] [49].
- Incubation: Incubate the cell suspension for 5-15 minutes at room temperature (15-25°C) in the dark to prevent photobleaching of the fluorochromes [1].
- Analysis: Analyze the stained cells by flow cytometry within 1 hour. Use an excitation wavelength of 488 nm. Measure FITC (Annexin V) fluorescence at approximately 530 nm (FL1 detector) and PI fluorescence at >570 nm (FL2 or FL3 detector) [1]. A minimum of 10,000 events per sample is recommended for statistically significant analysis.
Click-iT TUNEL Imaging Assay Protocol for Cultured Cells
This protocol details the procedure for detecting late-stage apoptosis using the Click-iT TUNEL methodology, which offers enhanced specificity through click chemistry [87].
Key Research Reagent Solutions:
- Terminal Deoxynucleotidyl Transferase (TdT): Enzyme that adds nucleotides to DNA breaks.
- EdUTP (5-ethynyl-2'-deoxyuridine): Alkyne-modified nucleotide incorporated into fragmented DNA.
- Click-iT Reaction Cocktail: Contains fluorescent azide dye for detection via copper-catalyzed cycloaddition.
- Fixation and Permeabilization Reagents: Typically paraformaldehyde and Triton X-100 or saponin.
- DNase I (optional): For generating a positive control.
- Blocking Solution: e.g., BSA, to reduce non-specific background.
Procedure:
- Sample Preparation and Fixation: Culture cells on glass coverslips or in chamber slides. After apoptotic induction, rinse cells briefly with PBS. Fix cells for 15 minutes at room temperature using 4% paraformaldehyde in PBS. Note: Avoid using cross-linking fixatives like glutaraldehyde, which can interfere with the assay [87].
- Permeabilization: Rinse fixed cells twice with PBS. Permeabilize the cells by incubating with a permeabilization reagent (e.g., 0.25% Triton X-100 in PBS) for 15-20 minutes on ice. This step allows the TdT enzyme and detection reagents to access the nuclear DNA.
- TdT Labeling: Prepare the TdT labeling reaction mix according to kit instructions, which includes the TdT enzyme and EdUTP. Apply the mix to the fixed and permeabilized cells and incubate in a humidified chamber for 60 minutes at 37°C [87].
- Click-iT Reaction: After labeling, wash the cells to remove unincorporated EdUTP. Prepare the Click-iT reaction cocktail containing the fluorescent azide (e.g., Alexa Fluor azide) and copper protectant. Apply this cocktail to the cells and incubate for 30 minutes at room temperature, protected from light [87].
- Counterstaining and Visualization: Rinse the cells thoroughly to remove the reaction cocktail. To visualize nuclei, counterstain with a nuclear dye such as Hoechst 33342 or DAPI. Mount the coverslips using an anti-fade mounting medium. Analyze the samples using a fluorescence microscope equipped with appropriate filter sets. TUNEL-positive nuclei will display the specific fluorescence of the incorporated azide dye [87].
Workflow Visualization of Key Apoptosis Assays
The following diagram illustrates the procedural workflow for both the Annexin V-FITC and TUNEL assays, highlighting their distinct sample preparation paths.
Applications in Biomedical Research & Drug Development
The strategic selection between Annexin V-FITC and TUNEL assays is dictated by the specific research question, with each method offering distinct advantages across various applications.
In high-throughput drug screening, the Annexin V-FITC assay is invaluable due to its rapid workflow and compatibility with flow cytometry. It enables the quick assessment of compound toxicity and the efficacy of chemotherapeutic agents by quantifying the percentage of cells in early apoptosis, providing a sensitive metric for treatment response [1]. The ability to simultaneously analyze viability with PI also offers immediate insight into the mechanism of cell death induced by candidate drugs. For necrotic screening, the TUNEL assay's limitation in differentiating apoptosis from necrosis can be mitigated by combining it with caspase-3 immunostaining, a specific marker for the apoptotic pathway. This double-labeling approach confirms the apoptotic nature of cell death, as demonstrated in studies of mouse thymocytes [90].
In toxicology and stem cell research, where understanding the timing of cell death is crucial, the Annexin V assay's sensitivity to early PS externalization allows for the detection of subtle perturbations in cell health before irreversible commitment to death occurs [1]. Furthermore, for histopathological analysis of archived clinical samples, such as formalin-fixed paraffin-embedded (FFPE) tissues, the TUNEL assay is the established method. Its compatibility with fixed and permeabilized tissue sections makes it ideal for identifying apoptotic cells within the complex architecture of patient tissue samples, a common requirement in translational cancer research [87] [89]. This application is particularly powerful when a colorimetric readout (e.g., HRP-DAB) is used, allowing for direct correlation with tissue morphology [87] [89].
The Annexin V-FITC and TUNEL assays are powerful, yet distinct, tools for apoptosis detection, each providing unique insights into the temporal progression of programmed cell death. The Annexin V-FITC assay is the superior choice for detecting initial apoptotic events at the plasma membrane level, offering a rapid, live-cell compatible method ideal for kinetic studies and high-throughput screening. In contrast, the TUNEL assay provides definitive confirmation of late-stage apoptosis through the identification of nuclear DNA fragmentation, making it indispensable for endpoint analyses, particularly in fixed tissues and histological specimens. A comprehensive apoptosis research strategy will often leverage the complementary strengths of both techniques—using Annexin V to capture the inception of cell death and TUNEL to confirm its terminal execution. The continued development of enhanced detection chemistries, such as the Click-iT system, further refines the sensitivity and specificity of these assays, solidifying their critical role in advancing our understanding of cell death in health, disease, and therapeutic intervention.
The comprehensive analysis of apoptosis remains a cornerstone in biomedical research and drug development. While the Annexin V-FITC assay for detecting phosphatidylserine (PS) externalization provides crucial information about early apoptotic events, it presents an incomplete picture when used in isolation. This technical guide examines how caspase activity assays serve as an essential mechanistic complement to PS externalization data, enabling researchers to distinguish between apoptotic pathways, verify regulated cell death, and overcome the limitations inherent in single-parameter apoptosis assessment. We provide detailed methodologies, comparative analyses, and integrated workflow strategies to enhance experimental rigor in apoptosis research.
Apoptosis, or programmed cell death, is characterized by distinct morphological and biochemical changes essential for normal development, tissue homeostasis, and elimination of damaged cells [91]. Two fundamental hallmarks of apoptosis have become primary detection targets: the externalization of phosphatidylserine (PS) on the cell membrane and the activation of caspase proteases within the cytosol. The Annexin V-FITC assay capitalizes on the translocation of PS from the inner to outer leaflet of the plasma membrane, one of the earliest detectable events in apoptosis [53] [92]. This exposure creates an "eat me" signal that can be detected by fluorescently labeled Annexin V protein in a calcium-dependent manner. However, PS externalization alone does not conclusively demonstrate apoptotic commitment, as this phenomenon can occur in other forms of cell death and under certain non-lethal cellular conditions [13] [93] [94]. Thus, the integration of caspase activity measurements provides essential mechanistic validation of apoptotic progression through defined biochemical pathways.
Fundamental Principles of Key Apoptosis Assays
Annexin V-FITC and PS Externalization
The Annexin V-FITC/PI apoptosis detection kit represents a standardized approach for identifying PS externalization. The assay utilizes fluorescein isothiocyanate (FITC)-conjugated Annexin V, which binds specifically to exposed PS residues, while propidium iodide (PI) serves as a viability dye that penetrates cells with compromised membrane integrity [53] [92]. This dual-staining approach allows discrimination between:
- Viable cells: Annexin V-FITC negative, PI negative
- Early apoptotic cells: Annexin V-FITC positive, PI negative
- Late apoptotic/necrotic cells: Annexin V-FITC positive, PI positive
The biochemical basis of this assay relies on the loss of membrane asymmetry during apoptosis, though it's crucial to note that recent research has demonstrated that PS externalization can be fully uncoupled from apoptosis in some experimental models [13]. Furthermore, certain forms of differentiation-triggered apoptosis occur through mechanisms that externalize PS independent of caspases [93], highlighting the necessity for complementary assays to verify apoptotic mechanisms.
Caspase Activity Assays
Caspases are cysteine-aspartic proteases that function as central mediators of apoptosis, cleaving cellular substrates after aspartic acid residues [95] [96]. They exist as latent zymogens (procaspases) in healthy cells and undergo proteolytic activation during apoptosis initiation. Caspase assays typically utilize fluorogenic or chromogenic substrates containing specific caspase cleavage sequences tagged with reporter molecules [91]. Upon substrate cleavage, the released chromophore or fluorophore generates a detectable signal proportional to caspase activity.
Caspases are categorized based on their position in apoptotic signaling hierarchies:
- Initiator caspases (caspase-2, -8, -9, -10) activate the caspase cascade
- Effector caspases (caspase-3, -6, -7) execute the apoptotic program through substrate proteolysis
Table 1: Common Caspase Assay Substrates and Their Applications
| Caspase Type | Preferred Substrate | Cleavage Site | Detection Method | Research Applications |
|---|---|---|---|---|
| Caspase-8 | IETD conjugated to AMC, R110, or ProRed | IETD↓ | Fluorimetric, colorimetric | Death receptor pathway activation [91] |
| Caspase-9 | LEHD conjugated to fluorogenic tags | LEHD↓ | Fluorimetric | Intrinsic pathway monitoring [91] |
| Caspase-3/7 | DEVD conjugated to AMC, AFC, R110 | DEVD↓ | Fluorimetric, colorimetric | Apoptotic commitment verification [91] |
| Pan-caspase | Multi-caspase substrates | Varies | Fluorimetric | General apoptosis screening |
Technical Methodologies
Annexin V-FITC/PI Staining Protocol
The following protocol adapts standardized methodologies from commercial kits [53] [92] [54] for flow cytometric analysis:
- Cell Preparation: Harvest approximately 2-5×10⁵ cells per sample and wash with ice-cold PBS or culture medium.
- Buffer Preparation: Dilute 10X binding buffer to 1X concentration with distilled water (for 20 assays: 10 mL of 1X buffer is provided ready-to-use [53]).
- Cell Resuspension: Resuspend cell pellet in 195 μL of ice-cold 1X binding buffer.
- Staining: Add 5 μL of Annexin V-FITC and 10 μL of Propidium Iodide (20 μg/mL) to the cell suspension.
- Incubation: Incubate for 10-20 minutes at room temperature protected from light.
- Analysis: Within 1 hour, analyze by flow cytometry using FL1 (530 nm) for FITC and FL3 (617 nm) for PI detection.
Critical Considerations:
- Maintain samples on ice throughout processing to prevent artifactual PS externalization
- Include unstained, single-stained, and appropriate treatment controls
- Analyze samples promptly as PS externalization progresses over time
- The calcium-based binding buffer is essential for Annexin V binding [92]
Fluorimetric Caspase Activity Assay
The following protocol for caspase activity measurement adapts methodologies from commercial assay kits [91]:
- Cell Lysis: Collect 1-5×10⁶ cells and lyse in ice-cold caspase assay buffer containing protease inhibitors.
- Substrate Preparation: Prepare working solution of fluorogenic substrate (e.g., DEVD-R110 for caspase-3/7) in assay buffer.
- Reaction Setup: Combine cell lysate (50-100 μg protein) with substrate solution in a microplate.
- Incubation: Incubate at 37°C for 30-120 minutes protected from light.
- Detection: Measure fluorescence (excitation/emission: 496/520 nm for R110) using a microplate reader.
- Data Analysis: Normalize values to protein concentration and express as fold-change over control.
Critical Considerations:
- Include positive controls (e.g., staurosporine-treated cells)
- Use specific caspase inhibitors to confirm signal specificity
- Perform kinetic measurements to establish linear range of detection
- Caspase-3 serves as a crucial effector caspase that amplifies signals from initiator caspases and signifies full commitment to cellular disassembly [91]
Integrated Apoptosis Signaling Pathways
The extrinsic and intrinsic apoptotic pathways converge on caspase activation while displaying distinct regulation of PS externalization. The following diagram illustrates the key events detected by complementary assays:
Diagram 1: Integrated Apoptotic Signaling Pathways. This schematic illustrates how extrinsic and intrinsic apoptosis pathways converge on caspase-3/7 activation, which leads to PS externalization (detectable by Annexin V-FITC) and apoptotic body formation. Caspase-8 functions as a key initiator in the extrinsic pathway, while caspase-9 initiates the intrinsic pathway.
Comparative Analysis of Apoptosis Detection Methods
The integration of PS externalization and caspase activity data provides a more comprehensive understanding of apoptotic mechanisms than either method alone. The following table summarizes key distinctions and complementary aspects:
Table 2: Comparative Analysis of PS Externalization and Caspase Activity Assays
| Parameter | PS Externalization (Annexin V-FITC) | Caspase Activity Assays |
|---|---|---|
| Detection Target | Loss of membrane phospholipid asymmetry | Proteolytic cleavage of specific substrates |
| Primary Applications | Early apoptosis detection, phagocytosis studies | Apoptotic pathway verification, mechanism determination |
| Temporal Resolution | Early event (may precede caspase activation) | Committed phase of apoptosis |
| Key Advantages | Distinguishes early vs. late apoptosis when combined with PI, simple protocol | Specific for apoptotic machinery, can identify specific pathways |
| Notable Limitations | Not apoptosis-specific (occurs in other death forms) [13] [94] | May miss caspase-independent apoptosis |
| Experimental Considerations | Requires careful handling to prevent necrosis artifacts | Requires optimization of substrate specificity |
| Quantitative Capabilities | Semi-quantitative (population distribution) | Highly quantitative (kinetic measurements possible) |
| Complementary Role | Identifies early membrane changes | Confirms apoptotic mechanism |
Strategic Integration in Experimental Workflows
The sequential application of Annexin V-FITC and caspase activity assays provides temporal resolution of apoptotic progression. The following workflow diagram illustrates their strategic integration:
Diagram 2: Integrated Experimental Workflow for Apoptosis Detection. This workflow illustrates the sequential application of Annexin V-FITC/PI staining followed by caspase activity assays to temporally resolve apoptotic progression and verify commitment to cell death.
Research Reagent Solutions
Successful implementation of integrated apoptosis assessment requires carefully selected reagents. The following table outlines essential components:
Table 3: Essential Research Reagents for Integrated Apoptosis Analysis
| Reagent Category | Specific Examples | Function & Application | Key Considerations |
|---|---|---|---|
| PS Detection Kits | Annexin V-FITC/PI Apoptosis Kit [53] | Simultaneous detection of PS exposure and membrane integrity | Includes binding buffer with calcium; 20-100 assay sizes available |
| Caspase Substrates | IETD-based (caspase-8), DEVD-based (caspase-3/7) [91] | Fluorogenic or chromogenic detection of specific caspase activities | Substrate specificity must be verified; AMC, AFC, R110 provide different detection options |
| Caspase Assay Kits | Cell Meter Caspase Activity Kits [91] | Optimized reagent systems for specific caspase detection | Designed for high-throughput applications; include necessary buffers |
| Binding Buffers | Calcium-based binding buffer [92] [54] | Provides optimal conditions for Annexin V-PS interaction | Critical for assay performance; calcium concentration must be maintained |
| Viability Indicators | Propidium Iodide (PI), 7-AAD | Discrimination of membrane integrity status | PI is standard for flow cytometry; alternative dyes available for specific platforms |
| Positive Controls | Staurosporine, Camptothecin | Induction of apoptosis for assay validation | Essential for establishing assay performance and timing |
Discussion and Future Perspectives
The integration of caspase activity assays with PS externalization detection represents a methodological imperative for rigorous apoptosis research. While Annexin V-FITC staining provides sensitive detection of early membrane alterations, it cannot distinguish between apoptosis and other forms of cell death characterized by PS exposure, such as necroptosis [94] or differentiation-associated externalization [93]. Furthermore, emerging evidence challenges the assumption that PS externalization is sufficient to trigger immunosuppressive responses, suggesting more complex regulation of apoptotic immunomodulation [13].
Caspase activity measurements provide essential mechanistic confirmation of apoptotic signaling through defined biochemical pathways. The ability to detect specific initiator caspases (e.g., caspase-8 for extrinsic pathway, caspase-9 for intrinsic pathway) enables researchers to delineate the apoptotic trigger and identify potential pathway-specific therapeutic interventions [91]. Moreover, the quantitative nature of caspase activity assays facilitates kinetic studies of apoptotic progression and inhibitor screening.
Future methodological developments will likely focus on multiplexed platforms that simultaneously monitor PS externalization, caspase activation, and mitochondrial parameters in live cells. Such integrated approaches will provide unprecedented resolution of apoptotic commitment and execution, particularly valuable in heterogeneous systems such as primary tumors or mixed immune populations. Additionally, the continued refinement of caspase-specific probes with improved spectral properties and cellular permeability will enable more precise temporal mapping of apoptotic progression in real time.
For researchers employing these complementary techniques, we recommend: (1) establishing kinetic profiles for both PS externalization and caspase activation for each new model system; (2) implementing appropriate controls to account for cell-type-specific variations in apoptotic execution; and (3) correlating biochemical data with morphological assessment to validate apoptotic progression. Through such rigorous integrated approaches, the scientific community can advance both fundamental understanding of cell death mechanisms and translation of this knowledge to therapeutic applications.
In the field of cell death research, accurate detection of apoptosis is fundamental for understanding cellular mechanisms in drug development, cancer research, and toxicology. While metabolic assays such as MTT (3-(4,5-dimethylthiazol-2-yl)-2,5-diphenyltetrazolium bromide) and LDH (Lactate Dehydrogenase) have been widely used for decades as indirect measures of cell viability and cytotoxicity, they present significant limitations for detecting early apoptotic events. The Annexin V-FITC assay, based on the specific binding to phosphatidylserine (PS) externalized on the cell surface during early apoptosis, provides a direct and mechanistic approach to identifying cells in the initial phases of programmed cell death [97]. This technical guide examines the distinct advantages of Annexin V-FITC over metabolic assays, providing researchers with a framework for selecting appropriate detection methods based on their specific experimental requirements and the biological questions being addressed.
Fundamental Principles: Annexin V-FITC vs. Metabolic Assays
Annexin V-FITC Mechanism
The Annexin V-FITC assay operates on a well-defined biological principle that enables specific detection of early apoptosis. During the early stages of programmed cell death, phosphatidylserine (PS)—a phospholipid normally restricted to the inner leaflet of the plasma membrane—translocates to the external surface [97]. Annexin V, a 35-36 kDa calcium-dependent phospholipid-binding protein, exhibits high affinity for exposed PS [98]. When conjugated to fluorescein isothiocyanate (FITC), this binding provides a direct fluorescent marker for cells undergoing early apoptosis. The protocol is typically combined with a viability dye such as propidium iodide (PI) that only penetrates cells with compromised membranes, allowing clear differentiation between viable (Annexin V-/PI-), early apoptotic (Annexin V+/PI-), late apoptotic (Annexin V+/PI+), and necrotic (Annexin V-/PI+) populations [97] [5]. This multiparametric discrimination provides nuanced information about cell population distributions that is unavailable through metabolic assays.
Metabolic Assay Limitations
Metabolic assays like MTT and LDH measure indirect correlates of cell health rather than specific death pathways. The MTT assay quantifies the reductive capacity of cells through the conversion of a tetrazolium salt to insoluble formazan by active mitochondrial dehydrogenases [99]. This measurement reflects overall metabolic activity but cannot distinguish between reduced metabolism due to apoptosis and other causes. Similarly, the LDH assay detects the release of the cytoplasmic enzyme lactate dehydrogenase from cells with compromised membranes, serving as a marker for loss of membrane integrity [99]. This event occurs predominantly during late-stage apoptosis or necrosis, making LDH ineffective for early apoptosis detection. A critical limitation of both methods is their inability to provide specific information about the mode or stage of cell death, as they measure surrogate markers rather than direct apoptotic events.
Comparative Analysis: Key Technical Differences
The following tables summarize the fundamental technical distinctions between Annexin V-FITC and metabolic assays, highlighting their implications for experimental design and data interpretation.
Table 1: Methodological Comparison of Apoptosis Detection Assays
| Parameter | Annexin V-FITC | MTT Assay | LDH Assay |
|---|---|---|---|
| Detection Principle | Phosphatidylserine externalization | Mitochondrial reductase activity | Membrane integrity loss |
| Primary Detection | Early apoptosis | Metabolic activity | Late apoptosis/necrosis |
| Temporal Resolution | Early event detection | Late event detection | Late event detection |
| Specificity for Apoptosis | High | Low | Low |
| Cell Death Stage Discrimination | Yes (early/late apoptosis, necrosis) | No | Partial |
| Compatibility with Live Cells | Yes | No (endpoint) | No (endpoint) |
| Throughput Capacity | Moderate to High | High | High |
| Multiplexing Potential | High (with other fluorescent markers) | Low | Low |
Table 2: Quantitative Performance Metrics
| Performance Characteristic | Annexin V-FITC | MTT Assay | LDH Assay |
|---|---|---|---|
| Detection Timeline | 2-4 hours post-apoptotic stimulus | 12-24 hours post-stimulus | 8-12 hours post-stimulus |
| Minimum Detectable Population | 1-5% (flow cytometry) | 10-15% population change | 10-20% population change |
| Sample Requirements | 1-5 × 10^5 cells/assay [97] | 5-10 × 10^3 cells/well | 1-5 × 10^4 cells/well |
| Assay Time | 2-3 hours (including staining) | 4-6 hours (including incubation) | 1-2 hours |
| Signal Stability | Moderate (requires rapid analysis) [61] | High (formazan crystals stable) | High (colorimetric signal stable) |
Experimental Protocols
Annexin V-FITC Staining Protocol for Flow Cytometry
The following workflow illustrates the key steps in the Annexin V-FITC apoptosis detection protocol:
Detailed Protocol:
Cell Preparation: Harvest 1-5 × 10^5 cells by gentle trypsinization (for adherent cells) using EDTA-free reagents, as EDTA can chelate calcium and interfere with Annexin V binding [61]. Include both floating and adherent cell populations to ensure complete representation of apoptotic cells.
Washing and Resuspension: Wash cells twice with cold phosphate-buffered saline (PBS) and centrifuge at 670 × g for 5 minutes at room temperature. Resuspend the cell pellet in 500 µL of 1X Annexin V binding buffer [97] [5].
Staining: Add 5 µL of Annexin V-FITC and 5 µL of propidium iodide (PI) to the cell suspension. Include appropriate controls: unstained cells, Annexin V-FITC only, and PI only for compensation and gating optimization [61] [5].
Incubation: Incubate the stained cells for 5 minutes at room temperature in the dark to prevent fluorophore photobleaching.
Analysis: Analyze samples immediately using flow cytometry with excitation at 488 nm. Detect FITC emission at 530 nm (FL1 detector) and PI emission at >575 nm (FL2 or FL3 detector). Analyze a minimum of 10,000 events per sample for statistical significance [97] [43].
Critical Controls and Optimization Steps
- Viability Control: Include untreated healthy cells as a negative control to establish baseline staining.
- Positive Control: Treat cells with a known apoptosis inducer (e.g., 1-2 µM staurosporine for 3-4 hours) to verify assay performance.
- Compensation Controls: Use single-stained samples to correct for spectral overlap between FITC and PI channels [61].
- Gating Strategy: Exclude debris and aggregates based on forward and side scatter properties before analyzing fluorescence parameters.
The Scientist's Toolkit: Essential Research Reagents
Table 3: Key Reagents for Annexin V-FITC Apoptosis Detection
| Reagent/Material | Function/Purpose | Considerations |
|---|---|---|
| Annexin V-FITC | Binds externalized phosphatidylserine | Light-sensitive; requires calcium-dependent binding buffer |
| Propidium Iodide (PI) | DNA intercalating dye identifying membrane-compromised cells | Distinguishes late apoptotic/necrotic cells; must be used with RNAse in some protocols |
| Annexin V Binding Buffer | Provides optimal calcium concentration and pH | Critical for specific binding; HEPES-based with 2.5 mM Ca²⁺ |
| EDTA-free Dissociation Reagent | Detaches adherent cells without affecting Annexin V binding | EDTA chelates Ca²⁺ and inhibits binding; use Accutase or enzyme-free solutions [61] |
| Flow Cytometer | Multiparametric analysis of fluorescent signals | Requires FITC (FL1) and PI (FL2) detection capabilities; 488 nm excitation |
| Apoptosis Inducer (Positive Control) | Validates assay performance | Staurosporine, camptothecin, or drug-specific treatments |
Advantages of Annexin V-FITC for Early Apoptosis Detection
Temporal Advantage: Detection Timeline
The most significant advantage of Annexin V-FITC over metabolic assays lies in its early detection capability. Phosphatidylserine externalization occurs within 2-4 hours after apoptotic induction, preceding the loss of mitochondrial function (measured by MTT) and membrane integrity (measured by LDH) by several hours [97]. This temporal advantage enables researchers to identify apoptotic commitment before irreversible metabolic collapse, providing a critical window for investigating early signaling events and potential intervention points. Metabolic assays typically require 12-24 hours post-induction to detect significant changes, capturing later-stage events after cells have committed to death pathways.
Specificity and Mechanism-Based Detection
Annexin V-FITC provides specific detection of apoptotic cells through a defined molecular mechanism—phosphatidylserine translocation. This specificity contrasts with metabolic assays that respond to various cellular stresses unrelated to apoptosis. The MTT assay measures mitochondrial reductase activity, which can be influenced by numerous factors including cell proliferation rates, metabolic inhibitors, and mitochondrial uncouplers that don't necessarily induce apoptosis [99]. Similarly, LDH release indicates membrane damage but cannot differentiate between apoptotic, necrotic, and mechanically damaged cells. The Annexin V assay specifically identifies the apoptotic process through its direct interaction with a well-established biochemical marker of programmed cell death.
Multiparametric Analysis and Population Discrimination
The combination of Annexin V-FITC with viability dyes like PI enables simultaneous assessment of multiple cell states within a heterogeneous population. This approach provides quantitative data on the distribution of viable, early apoptotic, late apoptotic, and necrotic cells in a single assay [97] [43]. Flow cytometry analysis allows for gating strategies that can exclude debris and focus on specific subpopulations, and can be further combined with antibody staining for surface markers or intracellular proteins to investigate cell death mechanisms in specific cell types [43]. This multidimensional analysis is unavailable in metabolic assays, which provide only population-averaged measurements without information about individual cell states or death pathways.
Limitations and Technical Considerations
Annexin V-FITC Constraints
Despite its advantages, the Annexin V-FITC assay has limitations that researchers must consider. The method cannot distinguish between apoptosis and other forms of programmed cell death that involve phosphatidylserine exposure, such as necroptosis and pyroptosis [97] [100]. The binding is calcium-dependent, requiring precise buffer conditions, and is reversible, which may affect signal stability during extended analysis [97]. Additionally, the assay requires single-cell suspensions and flow cytometry equipment, which may not be accessible in all laboratory settings. False positives can occur with mechanical cell damage, excessive trypsinization, or edge effects in cell culture, necessitating careful experimental technique and appropriate controls [61].
Complementary Approaches
For comprehensive cell death analysis, Annexin V-FITC can be combined with other methods to overcome individual limitations. Caspase activity assays provide additional mechanistic information about apoptotic pathway activation [100]. Nuclear staining with Hoechst or DAPI allows visualization of chromatin condensation and nuclear fragmentation, hallmarks of late apoptosis [101]. For distinguishing between apoptosis and necroptosis, additional markers such as RIPK1/RIPK3 activation or MLKL phosphorylation should be examined [100] [99]. Metabolic assays may still have value as initial screening tools before more specific apoptosis detection methods are applied.
The Annexin V-FITC assay provides significant advantages over traditional metabolic assays for detecting early apoptosis, offering mechanistic specificity, temporal precision, and multiparametric discrimination that MTT and LDH assays cannot deliver. While metabolic assays remain useful for high-throughput viability screening and measuring general cytotoxicity, they lack the specificity and early detection capabilities required for detailed apoptosis research. The choice between these methods should be guided by experimental goals: metabolic assays for rapid viability assessment versus Annexin V-FITC for specific, early apoptosis detection and mechanistic studies. As cell death research continues to evolve, understanding the appropriate application and limitations of each method remains essential for generating reliable, interpretable data in biomedical research.
This technical guide explores the critical relationship between phosphatidylserine (PS) externalization and the loss of mitochondrial membrane potential (ΔΨm) during apoptosis. We provide a comprehensive analysis of the temporal sequence of these events, detailed methodologies for simultaneous detection using Annexin V-FITC and JC-1 dye, and practical guidance for data interpretation in drug development research. By establishing a clear correlation between these key apoptotic markers, this whitepaper serves as an essential resource for researchers investigating cell death mechanisms, screening novel therapeutic compounds, and validating drug efficacy through multiparameter apoptosis assessment.
The systematic analysis of apoptosis is fundamental to biomedical research, particularly in oncology and drug discovery. Two of the most established biomarkers for programmed cell death are the translocation of phosphatidylserine (PS) to the outer leaflet of the plasma membrane and the collapse of the mitochondrial transmembrane potential (ΔΨm). The former is detected using fluorescently conjugated Annexin V, a phospholipid-binding protein with high affinity for PS, while the latter is monitored using potential-sensitive dyes such as JC-1. Understanding the correlation and temporal relationship between these events provides researchers with a more comprehensive understanding of apoptotic pathways and enables more accurate assessment of therapeutic efficacy.
Annexin V-FITC staining capitalizes on the calcium-dependent binding of Annexin V to PS residues that become exposed on the cell surface during early apoptosis, providing a sensitive method for detecting initial stages of cell death [1] [49]. Meanwhile, JC-1 dye serves as a ratiometric probe for ΔΨm, exhibiting potential-dependent accumulation in mitochondria that manifests as a fluorescence emission shift from green (~529 nm) to red (~590 nm) as mitochondria become more polarized [102] [103]. The integration of these techniques offers a powerful approach for delineating apoptotic sequences and validating mitochondrial involvement in cell death mechanisms.
Biological Foundations of Apoptotic Markers
Phosphatidylserine Externalization
In viable cells, phosphatidylserine is predominantly confined to the inner leaflet of the plasma membrane through the activity of ATP-dependent flippases [104]. During apoptosis, this asymmetric distribution is disrupted through two complementary mechanisms: caspase-mediated inactivation of flippases (specifically ATP11A and ATP11C) and activation of scramblases (including TMEM16F and Xkr8) that facilitate bidirectional movement of phospholipids [104]. The resulting PS externalization serves as a key "eat-me" signal for phagocytic cells to clear apoptotic cells, preventing inflammatory responses [49] [105].
Annexin V binding exploits this physiological phenomenon, with the 35-36kDa protein forming calcium-dependent complexes with exposed PS residues [49]. The conjugation of Annexin V to fluorochromes such as FITC enables sensitive detection of early apoptotic cells before membrane integrity is compromised. This assay is particularly powerful when combined with viability dyes like propidium iodide (PI) or 7-AAD, allowing discrimination between early apoptotic (Annexin V+/PI-), late apoptotic (Annexin V+/PI+), and necrotic cells (Annexin V-/PI+) [1] [49].
Mitochondrial Membrane Potential Collapse
The mitochondrial transmembrane potential (ΔΨm), typically ranging from -150 to -180 mV, is essential for ATP production, calcium homeostasis, and reactive oxygen species regulation [103]. During apoptosis, particularly through the intrinsic pathway, mitochondrial membrane permeability increases, leading to the opening of the mitochondrial permeability transition pore (MPTP), dissipation of ΔΨm, and release of pro-apoptotic factors such as cytochrome c [102].
JC-1 (5,5',6,6'-tetrachloro-1,1',3,3'-tetraethylbenzimidazolylcarbocyanine iodide) exhibits unique potential-dependent properties in mitochondria. At low ΔΨm or concentrations, JC-1 exists as green-fluorescent monomers (emission ~529 nm), while in energized mitochondria with high ΔΨm, it forms red-fluorescent "J-aggregates" (emission ~590 nm) [102] [103] [106]. This concentration-dependent fluorescence shift enables ratiometric measurements that are independent of mitochondrial size, shape, and density, providing a robust quantitative assessment of mitochondrial health [102].
Temporal Relationship Between PS Exposure and ΔΨm Loss
The sequential relationship between PS externalization and mitochondrial depolarization varies based on cell type and apoptotic stimulus. Research indicates that in many experimental models, PS exposure precedes or occurs concurrently with ΔΨm loss, suggesting complementary rather than strictly dependent processes.
Table 1: Temporal Sequence of Apoptotic Markers Across Different Experimental Models
| Cell Line | Apoptotic Stimulus | PS Exposure | ΔΨm Loss | Temporal Relationship | Reference |
|---|---|---|---|---|---|
| L929sAhFas | anti-Fas | Rapid | Subsequent | PS exposure precedes ΔΨm loss | [107] |
| PC60 RI/RII | TNF-, etoposide, staurosporine | Early | Later | PS-positive cells appear before decreased ΔΨm | [107] |
| 32D | Growth factor depletion | Concurrent | Concurrent | Both phenomena occur simultaneously | [107] |
| Various cancer lines (T98G, Daudi) | TRAIL, etoposide, camptothecin | Diminished | Present | Dissociation between markers; ΔΨm loss without significant PS exposure | [105] |
Notably, some cancer cell lines exhibit diminished PS externalization despite robust apoptosis induction through other markers. Studies using T98G glioblastoma, Daudi, and D32 cells demonstrated significant nuclear fragmentation, caspase activation, and ΔΨm loss with minimal Annexin V binding, suggesting alternative regulatory mechanisms for phospholipid scrambling in certain contexts [105]. This dissociation has important implications for drug screening, highlighting the necessity of multiparameter apoptosis assessment.
Experimental Protocols
JC-1 Staining for Mitochondrial Membrane Potential
Principle: JC-1 dye accumulates in mitochondria in a potential-dependent manner, forming red fluorescent J-aggregates in polarized mitochondria and remaining as green monomers in depolarized mitochondria [102] [103].
Materials:
- JC-1 dye (e.g., MitoProbe JC-1 Assay Kit, Thermo Fisher M34152) [102] [103]
- Carbonyl cyanide m-chlorophenyl hydrazone (CCCP) for positive control [103]
- Dimethyl sulfoxide (DMSO)
- Phosphate-buffered saline (PBS)
- Flow cytometer with 488 nm excitation and 530/30 nm (FITC) and 585/42 nm (PE) filters OR fluorescence microscope with FITC/TRITC filters [102]
Procedure for Flow Cytometry:
- Prepare a 200 μM JC-1 stock solution in DMSO immediately before use [103].
- Harvest and wash cells, resuspend in warm PBS or culture medium at approximately 1×10⁶ cells/ml [103].
- Add JC-1 to a final concentration of 2 μM and incubate at 37°C, 5% CO₂ for 15-30 minutes [103].
- For positive control, treat one sample with 50 μM CCCP for 5 minutes before JC-1 staining [103].
- Wash cells with warm PBS and centrifuge at 400×g for 5 minutes [103].
- Resuspend cells in PBS and analyze by flow cytometry using 488 nm excitation with 530 nm and 585 nm emission filters [102].
- Analyze data by calculating the red/green fluorescence ratio, where decreased ratios indicate mitochondrial depolarization [102].
Technical Considerations:
- JC-1 staining is incompatible with fixation; analysis must be performed on live cells [102].
- Alternative excitation at 405 nm can reduce spectral overlap between monomer and aggregate emissions, potentially eliminating the need for fluorescence compensation [106].
- The red/green fluorescence ratio is independent of mitochondrial size, shape, and density, providing a robust measurement of membrane potential [102].
Annexin V-FITC Staining for PS Exposure
Principle: Annexin V binds externalized phosphatidylserine in a calcium-dependent manner, while propidium iodide (PI) identifies cells with compromised membrane integrity [1] [49].
Materials:
- Annexin V-FITC conjugate (e.g., Abcam ab14085 or Thermo Fisher Scientific kits) [1] [49]
- Propidium iodide (PI) solution
- 1X Annexin V binding buffer
- Flow cytometer with 488 nm excitation and 530/30 nm (FITC) and >670 nm (PI) filters
Procedure:
- Induce apoptosis using desired experimental treatment.
- Harvest 1-5×10⁵ cells by gentle centrifugation (670×g for 5 minutes) [5].
- For adherent cells, use gentle trypsinization and wash with serum-containing media before staining [1].
- Resuspend cells in 500 μl of 1X Annexin V binding buffer [1].
- Add 5 μl Annexin V-FITC and 5 μl PI (optional) [1].
- Incubate at room temperature for 5 minutes in the dark [1].
- Analyze by flow cytometry within 1 hour using 488 nm excitation with FITC and PI detectors [1] [5].
- Identify populations: viable cells (Annexin V-/PI-), early apoptotic (Annexin V+/PI-), late apoptotic/necrotic (Annexin V+/PI+) [5].
Technical Considerations:
- Avoid fixation before staining as it disrupts membrane integrity and causes false positives [1].
- Include controls: unstained cells, Annexin V-only, and PI-only for proper compensation [5].
- The assay is calcium-dependent; ensure binding buffer contains adequate Ca²⁺ concentrations [49].
- High serum concentrations (>10%) may interfere with staining; optimize conditions accordingly [108].
Workflow for Correlative Analysis
Data Analysis and Interpretation
Flow Cytometry Analysis
For JC-1 analysis, monitor the red/green fluorescence ratio, where decreased ratios indicate mitochondrial depolarization [102]. For Annexin V, determine the percentage of cells in each quadrant: viable (Annexin V-/PI-), early apoptotic (Annexin V+/PI-), late apoptotic (Annexin V+/PI+), and necrotic (Annexin V-/PI+) [49].
Table 2: Interpretation of Combined JC-1 and Annexin V Staining Results
| JC-1 Red/Green Ratio | Annexin V Staining | PI Staining | Interpretation | Cellular Status |
|---|---|---|---|---|
| High | Negative | Negative | Healthy mitochondria, intact membrane | Viable cell |
| High | Positive | Negative | PS exposure with maintained ΔΨm | Very early apoptosis |
| Decreasing | Positive | Negative | Concurrent PS exposure and ΔΨm loss | Early apoptosis |
| Low | Positive | Positive | Loss of ΔΨm with membrane disruption | Late apoptosis |
| Low | Negative | Positive | Primary necrosis or late apoptosis | Necrotic cell |
Troubleshooting Common Issues
- High background in JC-1 staining: Ensure proper washing after staining and verify dye concentration. Consider alternative excitation at 405 nm to reduce monomer spillover into the J-aggregate detection channel [106].
- Weak Annexin V signal: Verify calcium concentration in binding buffer and use fresh reagents. Ensure apoptosis has been adequately induced [1].
- Discordant results between markers: Consider cell-type specific variations in apoptotic pathways. Some cells may undergo death with minimal PS exposure despite robust ΔΨm loss [105].
- Compensation issues in flow cytometry: Use single-stained controls for both JC-1 monomers (CCCP-treated) and J-aggregates (untreated) to establish proper compensation [106].
Research Reagent Solutions
Table 3: Essential Reagents for PS Exposure and ΔΨm Analysis
| Reagent | Function | Example Products | Key Considerations |
|---|---|---|---|
| JC-1 dye | Mitochondrial membrane potential indicator | MitoProbe JC-1 Assay Kit (Thermo Fisher M34152) [102] [103] | Incompatible with fixation; requires ratiometric analysis |
| Annexin V conjugates | PS exposure detection | Annexin V, Alexa Fluor conjugates (Thermo Fisher) [49]; CF Dye Annexin V Conjugates (Biotium) [108] | Calcium-dependent binding; requires viable cells |
| Viability dyes | Membrane integrity assessment | Propidium iodide, 7-AAD, SYTOX dyes [49] | Distinguish early vs. late apoptosis |
| Mitochondrial disruptors | Positive controls for ΔΨm loss | CCCP, valinomycin [102] [103] | Validate JC-1 response |
| Binding buffers | Optimize staining conditions | Annexin binding buffer (5X) [49] | Maintain calcium concentration |
Advanced Technical Considerations
Spectral Optimization for JC-1
Traditional JC-1 protocols recommend 488 nm excitation, but this wavelength efficiently excites both monomers and J-aggregates, leading to significant spectral overlap that requires compensation [106]. Recent investigations demonstrate that 405 nm excitation produces J-aggregate signals with considerably less spillover from monomer fluorescence, potentially eliminating the need for compensation and improving data accuracy [106]. This approach leverages the differential excitation efficiency—at 405 nm, J-aggregates are excited ~16-fold less efficiently than at 488 nm, but monomers are excited ~5-fold less efficiently than J-aggregates at this wavelength, resulting in improved separation [106].
Dynamic Range and Quantitative Analysis
The ratiometric nature of JC-1 staining provides inherent advantages for quantitative comparisons. The fluorescence intensity ratio depends only on the membrane potential and is unaffected by variations in mitochondrial size, shape, and density that often confound single-component fluorescence measurements [102]. This enables more accurate determination of the percentage of mitochondria within a population that respond to applied stimuli, such as drug treatments [102].
For Annexin V staining, the difference in fluorescence intensity between apoptotic and non-apoptotic cells typically reaches approximately 100-fold, providing excellent dynamic range for detecting early apoptotic populations [49]. This high sensitivity makes Annexin V binding particularly valuable for detecting initial stages of apoptosis before morphological changes become apparent.
The correlation between phosphatidylserine exposure and mitochondrial membrane potential changes provides critical insights into apoptotic sequencing and mechanism of action studies for drug development. While these events often occur concurrently, their temporal relationship varies based on cell type and apoptotic stimulus, emphasizing the importance of multiparameter assessment. The integrated experimental approaches outlined in this technical guide—combining JC-1 staining for ΔΨm with Annexin V-FITC detection of PS exposure—offer researchers a robust framework for comprehensive apoptosis analysis. By implementing optimized protocols, appropriate controls, and sophisticated data interpretation strategies, scientists can accurately delineate cell death pathways and more effectively screen therapeutic compounds targeting apoptotic mechanisms.
The study of apoptosis, or programmed cell death, is fundamental to biomedical research, playing a critical role in development, immune regulation, and the mechanism of action of many drugs. For decades, the gold standard for its detection has been the annexin V staining assay. This method relies on the calcium-dependent binding of annexin V protein to phosphatidylserine (PS), a phospholipid that translocates from the inner to the outer leaflet of the plasma membrane during early apoptosis [49] [1]. While highly useful, this and other label-based techniques (e.g., TUNEL assays, caspase activity measurements) possess inherent limitations. The requirement for fluorescent labels or dyes introduces risks of phototoxicity, photobleaching, and potential modulation of biological functions due to physical or chemical interaction with the target molecule [109] [110]. Furthermore, these methods are often endpoint assays, can lack specificity for distinguishing between different types of regulated cell death, and may be difficult to apply for in vivo monitoring [110] [111].
In response to these challenges, label-free approaches have come into focus. Among them, Raman microspectroscopy has emerged as a powerful, reagent-free analytical technique that leverages the intrinsic molecular "fingerprints" of a sample to provide non-disruptive, quantitative analysis in situ [109] [110]. This whitepaper explores the potential of Raman spectroscopy as a transformative tool for apoptosis research and drug development, framing its advancements within the context of the widely established annexin V FITC principle.
The Principle of Raman Microspectroscopy as a Label-Free Alternative
Raman spectroscopy is an analytical technique that probes the chemical structure of a sample based on the inelastic scattering of light. When a molecular substance is irradiated with monochromatic light (typically a laser), most light scatters elastically (Rayleigh scattering). However, a tiny fraction (approximately one in a million photons) scatters inelastically, with a shift in wavelength that corresponds to the vibrational energy of molecular bonds in the sample. This inelastic component is the Raman scattering light [109] [112].
A plot of the intensity of this scattered light versus the energy shift (Raman shift, measured in cm⁻¹) is known as a Raman spectrum. This spectrum, often called a "molecular fingerprint," is inherent to a molecule because the vibrational modes are determined by its unique chemical structure [109]. The key advantage for life sciences is that this measurement requires no labels or pretreatment; it can be performed on living cells and tissues in their native, aqueous environment without disruption [109] [113]. It is non-destructive, reproducible, and provides quantitative information, as the scattering intensity is proportional to the number of scatterers [109].
Table 1: Key Advantages of Label-Free Raman Spectroscopy over Annexin V Staining
| Feature | Annexin V Staining | Raman Microspectroscopy |
|---|---|---|
| Principle | Binding to externalized Phosphatidylserine | Intrinsic molecular vibrational fingerprints |
| Label Requirement | Yes (fluorescent dye) | No |
| Sample Preparation | Required (staining, washing) | Minimal to none |
| Sample Status | Typically fixed or live with care | Live cells and tissues, in situ |
| Quantitative Output | Semi-quantitative (fluorescence intensity) | Quantitative (scattering intensity proportional to concentration) |
| Multiplexing Capability | Limited by dye spectra | Inherent; all molecules contribute to spectrum |
| Risk of Artifacts | Yes (e.g., false positives from membrane damage) [49] | Low |
Detecting Apoptosis: From Phospholipid Translocation to Biochemical Fingerprinting
The annexin V assay identifies a single, specific event in apoptosis: the externalization of phosphatidylserine. In contrast, Raman spectroscopy provides a holistic view of the cell's biochemical composition, capturing a wide array of molecular changes that occur during cell death. This includes, but is not limited to, changes in nucleic acids, proteins, lipids, and collagen [111].
Research has consistently identified specific alterations in the Raman spectra of apoptotic cells. A prominent finding is a decrease in Raman signal intensity associated with DNA, as observed in studies of drug-induced apoptosis in tumors. For example, treatment with doxorubicin, a DNA-intercalating agent, led to a 59.4% decrease in the DNA signal intensity at 785 cm⁻¹, which showed a near-perfect spatial overlap with immunohistochemical staining for cleaved-caspase-3, a classic apoptotic marker [111]. This reduction in DNA signal is congruent with the nuclear degradation that characterizes apoptosis.
Other spectral changes reported during apoptosis include a decrease at 1003 cm⁻¹ (associated with proteins) and alterations in lipid signals [110] [111]. These changes reflect the complex biochemical cascade of apoptosis, including chromatin condensation, protein degradation, and changes in membrane composition. The ability to monitor these multiple biomarkers simultaneously provides a more comprehensive and robust assessment of cell death than a single parameter assay.
Table 2: Key Raman Spectral Shifts Associated with Cell Death Processes
| Raman Shift (cm⁻¹) | Biomolecular Assignment | Reported Change in Apoptosis | Related Cell Death Process |
|---|---|---|---|
| ~785 cm⁻¹ | DNA (O-P-O backbone stretching) | Decrease [111] [114] | Apoptosis (DNA fragmentation) |
| ~1003 cm⁻¹ | Phenylalanine (protein) | Decrease [110] | Late apoptosis |
| ~1250 cm⁻¹ | Amide III (protein) / Collagen | Increase in collagen in fibrosis [109] | Tissue remodeling post-infarction |
| ~939 cm⁻¹ | Collagen (C-C stretching) | Decrease [110] | Ferroptosis |
| ~498 cm⁻¹ | S-S disulphide stretching | Increase with antioxidants [113] | Oxidative stress response |
| ~1440 cm⁻¹ | CH₂ deformation (lipids) | Decrease under pro-oxidant stress [113] | Lipid peroxidation |
Advanced Applications: Discrimination of Cell Death Modalities and In Vivo Analysis
A significant advancement enabled by Raman spectroscopy is the ability to not just detect cell death, but to discriminate between different types of regulated cell death (RCD), such as apoptosis, ferroptosis, and necroptosis. Since these modalities operate through distinct genetic and biochemical machinery, they impart subtly different biochemical "fingerprints" that can be deciphered.
A 2025 study combined Raman microscopy with machine learning to investigate these RCD types in a murine fibroblast cell line. The study found that while some changes were subtle, machine learning models, particularly Support Vector Machines (SVM) utilizing the full spectra, could correctly predict the cell death type with 73% accuracy. This approach outperformed other analytical strategies, demonstrating that Raman spectroscopy, aided by sophisticated data analysis, can classify cell death subtypes in a label-free manner, a task that is challenging with annexin V staining alone [110].
Furthermore, Raman spectroscopy has been successfully applied for in vivo detection of drug-induced apoptosis. Using fiber-optic probes, researchers have detected spectral changes associated with apoptosis within breast and melanoma tumors in live mice. This capability for real-time, in vivo monitoring of drug efficacy presents a significant clinical potential, allowing for rapid readout of therapy response and potentially guiding personalized treatment plans without the need for biopsy and staining [111].
Diagram: Experimental Workflow for Label-Free Apoptosis Analysis Using Raman Microspectroscopy. The process begins with a live cell sample and proceeds through spectral acquisition and analysis to generate a biochemical output.
Essential Research Reagent Solutions for Raman-Based Apoptosis Studies
Transitioning from traditional methods to Raman spectroscopy requires a specific set of tools. The following table details key components of a typical experimental setup for apoptosis research.
Table 3: Research Reagent Solutions for Raman Microspectroscopy Experiments
| Item | Function / Description | Example from Literature |
|---|---|---|
| Raman Microscope | Confocal system for high spatial resolution and 3D localization of signals. | Confocal inverted Raman microscope (Alpha 300M+, WITec) [113] |
| Excitation Laser | Monochromatic light source. Near-IR (e.g., 785 nm) is preferred to minimize fluorescence and cell damage. | 785 nm single-mode diode laser [113] [111] |
| Spectrometer & Detector | To disperse and detect the Raman scattered light with high sensitivity. | Spectrometer with CCD camera (e.g., QE65000) [115] |
| Cell Culture Media (Phenol-red free) | Supports live cells during measurement without contributing interfering background signals. | Phenol-red-free DMEM/F-12 [113] |
| Quartz Coverslips | Provide low background signal for microscopy compared to standard glass. | 25 mm round quartz coverslip (UQG Optics) [113] |
| Apoptosis Inducers | Positive control reagents to induce apoptosis. | Camptothecin [49], Doxorubicin [111], anti-Fas antibody [110] |
| Data Analysis Software | For spectral preprocessing, multivariate analysis (PCA, PLS-DA), and machine learning (SVM). | GRAMS AI, Analyze IQ Lab, or custom scripts in Python/R [110] [115] |
Raman microspectroscopy represents a paradigm shift in apoptosis research and drug development. While the annexin V FITC principle remains a valuable and specific tool for detecting phosphatidylserine externalization, Raman spectroscopy offers a complementary and often more powerful label-free, non-disruptive, and quantitative alternative. Its capacity to provide a holistic view of the biochemical changes during cell death, to discriminate between different regulated cell death modalities with the aid of machine learning, and to enable in vivo monitoring of drug efficacy, positions it as a key technology for the future of cell biology and personalized medicine. As instrumentation and data analysis techniques continue to advance, the application of Raman spectroscopy is poised to move beyond specialized research labs and become an integral part of the drug development pipeline.
Annexin V binding to externalized phosphatidylserine (PS) is a cornerstone technique for detecting early apoptosis in biomedical research. However, a critical and often overlooked limitation is that PS exposure is not an exclusive hallmark of apoptosis. This technical guide details the mechanistic basis for this lack of specificity, identifying key non-apoptotic pathways that also expose PS, such as necroptosis, and provides a framework of complementary assays researchers must employ to confirm apoptotic death accurately. Within the broader context of Annexin V FITC principle research, recognizing this limitation is paramount for data integrity, especially in drug discovery and disease modeling.
The Annexin V-FITC assay is a widely adopted method for the early detection of apoptosis. Its principle relies on the high-affinity, calcium-dependent binding of Annexin V to phosphatidylserine (PS), a phospholipid that is actively maintained in the inner leaflet of the plasma membrane in viable cells [1] [11]. During the early stages of apoptosis, this membrane asymmetry collapses, and PS is translocated to the outer leaflet, making it accessible for Annexin V binding [11] [116]. When combined with a membrane-impermeant dye like propidium iodide (PI), the assay can distinguish between intact early apoptotic cells (Annexin V-positive, PI-negative) and late apoptotic or necrotic cells (Annexin V-positive, PI-positive) [61] [117].
For decades, the externalization of PS was considered a definitive marker of apoptosis. This "dogma" has been deeply embedded in cell biology research and is the foundation for countless published studies and commercial kit protocols [118]. The assay's simplicity, sensitivity, and compatibility with flow cytometry and fluorescence microscopy have solidified its status as a gold standard. However, advancing research now challenges this simplistic view, revealing that PS exposure is a common feature in several distinct modes of cell death and even in non-lethal cellular processes, thereby representing a significant limitation for specific apoptosis identification [118].
The Biochemical Principle of Annexin V Binding and Its Inherent Specificity Gap
The fundamental mechanism of Annexin V binding is elegant yet non-specific. The protein targets the phosphatidylserine headgroup itself, not the apoptotic process that leads to its externalization.
Maintenance of Membrane Asymmetry
In healthy cells, membrane lipid asymmetry is rigorously maintained by dedicated enzymatic systems:
- ATP-dependent flippases: Actively transport PS and phosphatidylethanolamine (PE) from the outer to the inner leaflet.
- Scramblases: In apoptotic cells, these enzymes are activated, facilitating the bidirectional movement of phospholipids and collapsing asymmetry [11] [118].
The Specificity Problem
Annexin V binds to PS with high affinity in a Ca²⁺-dependent manner, but it is agnostic to the upstream signaling events that caused PS exposure [1]. This creates an inherent "specificity gap." Any cellular stress, injury, or signaling pathway that results in the activation of scramblases or the inhibition of flippases will lead to PS externalization and generate a positive Annexin V signal, regardless of whether the cell is undergoing canonical apoptosis [11]. This limitation is not a failure of the Annexin V molecule itself, but a reflection of the complex biology of the plasma membrane.
Non-Apoptotic Pathways Involving Phosphatidylserine Exposure
Recognizing the specific non-apoptotic contexts where PS is exposed is critical for accurate data interpretation. The following pathways represent key sources of potential false positives in Annexin V-based apoptosis assays.
Necroptosis
Necroptosis is a genetically programmed form of necrotic cell death that induces strong inflammatory responses.
- Key Regulators: Activation of receptor-interacting protein kinase 3 (RIPK3) and phosphorylation of mixed lineage kinase domain-like (MLKL) protein are central to the pathway [118].
- Mechanism of PS Exposure: Phosphorylated MLKL oligomerizes and translocates to the plasma membrane, where it directly disrupts membrane integrity. This damage can lead to the externalization of PS, allowing Annexin V binding [118]. Consequently, a cell undergoing necroptosis can be Annexin V-positive, blurring the distinction with apoptosis.
Other Forms of Regulated Cell Death
Other cell death pathways can also present PS on the cell surface:
- Ferroptosis: An iron-dependent form of regulated necrosis driven by lipid peroxidation. The extensive oxidative damage to the plasma membrane can result in loss of asymmetry and PS exposure.
- Pyroptosis: A highly inflammatory form of cell death triggered by caspase-1 or caspase-4/5/11 activation, often in response to pathogens. Pore formation in the plasma membrane can lead to PS externalization.
Non-Lethal Cellular Processes
Crucially, PS exposure is not always a death sentence, further complicating the use of Annexin V as a standalone apoptosis marker.
- Cell Activation and Signaling: Activated macrophages, endothelial cells in tumor vasculature, and stressed tumor cells have been reported to expose PS without undergoing immediate cell death [11] [118].
- Platelet Activation: PS exposure on activated platelets is a critical step in the blood clotting cascade, a vital physiological process [11].
- Extracellular Vesicle (EV) Release: Microvesicles and other EVs shed from the plasma membrane often carry PS on their surface. Binding of Annexin V to these vesicles can contribute to background signal and misinterpretation [118].
The diagram below illustrates the core signaling pathways that lead to PS exposure, highlighting how distinct upstream triggers converge on this common downstream event.
Quantitative Comparison of PS-Exposing Cell Death Pathways
To effectively diagnose cell death, researchers must differentiate between key pathways. The table below summarizes the characteristic features of apoptosis and other PS-exposing processes.
Table 1: Key Characteristics of Apoptosis Versus Other PS-Exposing Cell Death Pathways
| Feature | Apoptosis | Necroptosis | Necrosis (Accidental) | Cellular Activation (e.g., Platelets) |
|---|---|---|---|---|
| PS Externalization | Yes (Early event) | Yes | Variable (late, passive) | Yes (Functional) |
| Caspase Dependence | Caspase-dependent (3, 7, 8, 9) | Caspase-independent (inhibited) | Caspase-independent | Not Applicable |
| Key Molecular Players | Caspases, Bcl-2 family, Cytochrome c | RIPK1, RIPK3, pMLKL | None (unregulated) | Scramblases, Signaling receptors |
| Membrane Integrity | Maintained in early stages | Compromised (MLKL pores) | Lost | Maintained |
| Nuclear Morphology | Chromatin condensation, DNA fragmentation | Condensation (variable) | Karyolysis | No change |
| Inflammatory Response | Non-inflammatory (immunologically silent) | Highly inflammatory | Highly inflammatory | Context-dependent (e.g., coagulation) |
| Annexin V/PI Profile | Early: Annexin V+/PI-Late: Annexin V+/PI+ | Often Annexin V+/PI+ (rapid) | Annexin V+/PI+ | Annexin V+/PI- |
Essential Methodologies for Discriminating Apoptosis from Other PS-Exposing Processes
Given the limitation of Annexin V as a standalone assay, confirmation of apoptosis requires a multi-parametric approach using complementary techniques.
Caspase Activity Assays
Since caspase activation is a hallmark of apoptosis but not of necroptosis or necrosis, measuring caspase activity is a primary confirmatory method.
- Principle: Use fluorogenic or chromogenic substrates that emit signal upon cleavage by active effector caspases (e.g., caspase-3/7).
- Protocol Outline:
- Harvest cells after treatment.
- Lyse cells or use live-cell permeable substrates.
- Incubate with caspase substrate (e.g., DEVD-AMC for caspase-3).
- Measure fluorescence (e.g., AMC: Ex/Em ~ 354/442 nm) using a plate reader.
- Interpretation: A significant increase in fluorescence concurrent with Annexin V positivity strongly indicates apoptosis. Its absence suggests a non-apoptotic, PS-exposing pathway.
Western Blotting for Key Death Pathway Markers
Immunoblotting provides direct evidence of the molecular events specific to different death pathways.
- Target Proteins:
- Apoptosis: Cleaved caspase-3, cleaved PARP.
- Necroptosis: Phosphorylated MLKL (pMLKL), phosphorylated RIPK3.
- Protocol Outline:
- Prepare cell lysates from treated and control samples.
- Separate proteins by SDS-PAGE and transfer to a membrane.
- Probe with specific antibodies against the target proteins (e.g., anti-cleaved caspase-3, anti-pMLKL).
- Use appropriate HRP-conjugated secondary antibodies and detect via chemiluminescence.
- Interpretation: The presence of cleaved caspase-3/PARP confirms apoptosis, while pMLKL confirms necroptosis.
Morphological Analysis by Microscopy
Visual assessment of cellular and nuclear morphology remains a powerful, albeit more subjective, discriminatory tool.
- Staining: Use DNA-binding dyes like Hoechst 33342 or DAPI to assess nuclear morphology.
- Key Morphological Features:
- Apoptosis: Cell shrinkage, membrane blebbing, chromatin condensation, and formation of apoptotic bodies.
- Necroptosis/Necrosis: Cell and organelle swelling (oncosis), but may also show some condensation.
- Protocol: After treatment, stain live or fixed cells with Hoechst 33342 (1-2 µg/mL for 15-30 min) and visualize under a fluorescence microscope.
Use of Pharmacological Inhibitors
Specific chemical inhibitors can functionally dissect the contributing death pathways.
- Common Inhibitors:
- Apoptosis: pan-caspase inhibitor (e.g., Z-VAD-FMK).
- Necroptosis: RIPK1 inhibitor (e.g., Necrostatin-1s) or MLKL inhibitor (e.g., Necrosulfonamide).
- Experimental Design: Pre-treat cells with an inhibitor prior to the death stimulus. If the Annexin V signal is abolished by Z-VAD-FMK but not by Necrostatin-1, the death is apoptotic. The reverse suggests necroptosis.
The following workflow provides a logical sequence for applying these techniques to distinguish between apoptosis and necroptosis confidently.
The Scientist's Toolkit: Essential Reagents for Apoptosis Discrimination
A robust investigation into cell death mechanisms requires a suite of reagents and tools. The following table lists key solutions for the experiments described in this guide.
Table 2: Key Research Reagent Solutions for Discriminating Cell Death Pathways
| Reagent / Kit | Primary Function | Key Application & Interpretation |
|---|---|---|
| Annexin V-FITC/PI Kit [61] [1] | Detects PS exposure and membrane integrity. | Flow Cytometry/Fluorescence Microscopy: Identifies populations with externalized PS. Distinguishes early (Annexin V+/PI-) from late (Annexin V+/PI+) stages, but not death modalities. |
| Caspase-3/7 Activity Assay Kit [1] | Measures effector caspase activation via fluorogenic substrate cleavage. | Plate Reader/Microplate Luminescence: A significant increase in activity concurrent with Annexin V binding strongly supports apoptosis. |
| Anti-Cleaved Caspase-3 Antibody | Specific detection of the active, proteolytically cleaved form of caspase-3 by Western Blot or ICC. | Western Blot/Immunocytochemistry: The presence of the ~17/19 kDa cleaved fragment is a definitive marker of apoptotic execution. |
| Anti-pMLKL Antibody | Detects the phosphorylated, active form of MLKL, a key necroptosis executioner. | Western Blot: The presence of pMLKL confirms activation of the necroptotic pathway, even in Annexin V-positive samples. |
| Z-VAD-FMK (pan-Caspase Inhibitor) | Irreversibly inhibits a broad range of caspases. | Functional Inhibition: Pre-treatment ablates apoptotic death. Preservation of Annexin V signal after Z-VAD suggests a non-apoptotic, PS-exposing pathway. |
| Necrostatin-1 (RIPK1 Inhibitor) | Selectively inhibits the kinase activity of RIPK1. | Functional Inhibition: Pre-treatment inhibits necroptosis. Used to test the contribution of RIPK1-dependent necroptosis to the observed cell death. |
| Hoechst 33342 / DAPI | Cell-permeant and cell-impermeant nuclear stains, respectively. | Fluorescence Microscopy: Visual assessment of nuclear morphology (condensation, fragmentation for apoptosis; swelling for necrosis). |
The Annexin V binding assay remains an invaluable tool for detecting the loss of plasma membrane asymmetry, an event characteristic of early apoptosis. However, its fundamental limitation lies in the fact that PS externalization is a convergent endpoint for multiple disparate cellular pathways, including necroptosis, cellular activation, and vesicle shedding. Reliance on Annexin V staining alone, particularly in complex biological systems or in response to novel therapeutic agents, is insufficient and can lead to the misclassification of cell death modalities.
For researchers, especially in drug development, the path forward requires a paradigm shift from single-parameter to multi-parameter validation. The integration of caspase activity assays, specific marker Western blotting, and morphological analysis is no longer a recommendation but a necessity for definitive apoptosis confirmation. By acknowledging this critical limitation and adopting a comprehensive experimental workflow, scientists can ensure the accuracy and reliability of their findings, ultimately leading to a more precise understanding of cell death in health and disease.
Conclusion
The Annexin V-FITC assay remains an indispensable, robust, and highly sensitive method for the early detection of apoptosis, crucial for evaluating the efficacy and safety of therapeutic compounds in drug discovery. Its power is maximized when used in conjunction with viability dyes like PI and when integrated into multiparametric workflows that assess proliferation and mitochondrial health. Future directions point toward the development of more specific probes to distinguish between apoptosis and other regulated cell death pathways, the increased use of innovative nanoscale and label-free detection methods for in vivo applications, and the continued integration of Annexin V staining into comprehensive phenotypic analyses to fully decipher complex cellular responses to treatment.
References
- 1. Annexin V staining assay protocol for apoptosis [https://www.abcam.com/en-us/technical-resources/protocols/annexin-v-for-apoptosis]
- 2. North America Apoptosis Assay Market Trends 2025–2034 [https://www.gminsights.com/industry-analysis/north-america-apoptosis-assay-market]
- 3. Apoptosis Testing Market Size, Demand & Forecast 2025- ... [https://www.futuremarketinsights.com/reports/apoptosis-testing-market]
- 4. "Reading cell death with light: Real-time visualization of ... [https://www.eurekalert.org/news-releases/1096590]
- 5. Protocol for Apoptosis Assay by Flow Cytometry Using ... [https://pmc.ncbi.nlm.nih.gov/articles/PMC4943750/]
- 6. Expression and purification of recombinant annexin V for ... [https://www.sciencedirect.com/science/article/abs/pii/S1046202307002137]
- 7. Annexin V-FITC Early Apoptosis Detection Kit #6592 [https://www.cellsignal.com/products/cellular-assay-kits/annexin-v-fitc-early-apoptosis-detection-kit/6592?srsltid=AfmBOoraomxxXObANLpN6NQz5MOkBMN_S1RPNJWbxHAkEc5gfkJjLrU3]
- 8. An Annexin V-FITC-Propidium Iodide-Based Method for ... [https://pubmed.ncbi.nlm.nih.gov/33683697/]
- 9. Annexin V-FITC/PI Apoptosis Detection Kit -40302ES - Yeasen [https://www.yeasenbio.com/products/40302]
- 10. [ Comparison between annexin - V /PI and Hoechst33342/PI...] FITC [https://pubmed.ncbi.nlm.nih.gov/25374090/]
- 11. Beyond annexin : fluorescence response of cellular membranes to... V [https://pmc.ncbi.nlm.nih.gov/articles/PMC3560882/]
- 12. Robust high-throughput kinetic analysis of apoptosis with ... [https://www.nature.com/articles/cddis2016332]
- 13. Phosphatidylserine externalization by apoptotic cells is ... [https://pmc.ncbi.nlm.nih.gov/articles/PMC9234239/]
- 14. A novel assay for apoptosis. Flow cytometric detection of phosphatidylserine expression on early apoptotic cells using fluorescein labelled Annexin V - PubMed [https://pubmed.ncbi.nlm.nih.gov/7622868/]
- 15. Annexin V-FITC Early Apoptosis Detection Kit #6592 [https://www.cellsignal.com/products/cellular-assay-kits/annexin-v-fitc-early-apoptosis-detection-kit/6592?srsltid=AfmBOoqgE3HSrpftPzpfpwPU_FKRwADyIW62v25cgDCdyyRqM_akEuAj]
- 16. Phosphatidylserine Externalization in Apoptosis | Bio-Techne [https://www.bio-techne.com/research-areas/apoptosis/phosphatidylserine-externalization]
- 17. Phosphatidylserine Externalization in Apoptosis [https://www.novusbio.com/research-topics/apoptosis/phosphatidylserine-externalization?srsltid=AfmBOoqBAqaN30_LyhJnminShltwMJCNYoWRRKtM4hOsKljaHZudamzO]
- 18. | AAT Bioquest Annexin V [https://www.aatbio.com/resources/application-notes/annexin-v]
- 19. Annexin V-FITC/PI staining for apoptosis evaluation [https://bio-protocol.org/exchange/minidetail?id=6759600&type=30]
- 20. Extracellular annexin A5: Functions of phosphatidylserine- ... [https://www.sciencedirect.com/science/article/pii/S016748890800044X]
- 21. Annexin V, the regulator of phosphatidylserine-catalyzed ... [https://pubmed.ncbi.nlm.nih.gov/9230931/]
- 22. Interfacial Basic Cluster in Annexin V Couples ... [https://www.sciencedirect.com/science/article/pii/S002192581931004X]
- 23. Quantitative analysis of annexin V-membrane interaction ... [https://pubmed.ncbi.nlm.nih.gov/25921613/]
- 24. V500 Annexin V [https://www.bdbiosciences.com/en-br/products/reagents/flow-cytometry-reagents/research-reagents/single-color-antibodies-ruo/v500-annexin-v.561501]
- 25. Annexin V Staining Protocol for Flow Cytometry [https://www.thermofisher.com/br/en/home/references/protocols/cell-and-tissue-analysis/protocols/annexin-v-staining-flow-cytometry.html]
- 26. Selective imaging of solid tumours via the calcium ... [https://pmc.ncbi.nlm.nih.gov/articles/PMC7135742/]
- 27. Phosphatidylserine exposure during apoptosis reflects ... [https://www.nature.com/articles/cdd201293]
- 28. FITC Labeling and Conjugation [https://tdblabs.se/about-the-company/blog/fitc-labeling-and-conjugation-2/]
- 29. FITC (Fluorescein Isothiocyanate) [https://www.aatbio.com/resources/application-notes/fitc-fluorescein-isothiocyanate]
- 30. Fluorescein (FITC) | Thermo Fisher Scientific - US [https://www.thermofisher.com/us/en/home/life-science/cell-analysis/fluorophores/fluorescein.html]
- 31. Fluorescein isothiocyanate (FITC) Conjugated Antibodies [https://www.cellsignal.com/learn-and-support/antibody-conjugates/fitc-conjugated-antibodies?srsltid=AfmBOorSsi3B1futDT0DcR51aNEZwlb_myZzPrpv4yqTvKcskTZytAPi]
- 32. FITC Dye Profile [https://app.fluorofinder.com/dyes/26-fitc-ex-max-490-nm-em-max-525-nm]
- 33. An efficient method for FITC labelling of proteins using ... [https://pmc.ncbi.nlm.nih.gov/articles/PMC6294648/]
- 34. Spectrum [FITC (Fluorescein-5-isothiocyanate)] [https://www.aatbio.com/fluorescence-excitation-emission-spectrum-graph-viewer/5_fitc_fluorescein_5_isothiocyanate]
- 35. Annexin V binding assay as a tool to measure apoptosis in ... [https://pubmed.ncbi.nlm.nih.gov/9894786/]
- 36. RealTime-Glo™ Annexin V Apoptosis Assay [https://www.promega.com/products/cell-health-assays/apoptosis-assays/realtime-glo-annexin-v-apoptosis-assay/]
- 37. Annexin V-FITC Early Apoptosis Detection Kit #6592 [https://www.cellsignal.com/products/cellular-assay-kits/annexin-v-fitc-early-apoptosis-detection-kit/6592?srsltid=AfmBOopHUPYSRBrywRU7oziXK9rZ6s51-KdfZQ-4Li7J6-ZZrnCCFpI8]
- 38. Modified annexin V/ propidium apoptosis assay for accurate... iodide [https://pubmed.ncbi.nlm.nih.gov/21540825/]
- 39. Flow cytometry-based quantitative analysis of cellular ... [https://pmc.ncbi.nlm.nih.gov/articles/PMC11260931/]
- 40. Modified Annexin V/Propidium Iodide Apoptosis Assay For ... [https://pmc.ncbi.nlm.nih.gov/articles/PMC3169266/]
- 41. non-drug propidium iodide [https://www.microbiomeprescription.com/library/modifier?mid2=699]
- 42. Flow Cytometry Analysis of Dose Response for Apoptosis ... [https://www.thermofisher.com/us/en/home/life-science/cell-analysis/flow-cytometry/flow-cytometry-learning-center/flow-cytometry-resource-library/flow-cytometry-application-notes/flow-cytometry-analysis-dose-response-apoptosis-induction.html]
- 43. Flow cytometry-based quantitative analysis of cellular ... [https://www.sciencedirect.com/science/article/pii/S2405844024096968]
- 44. BD Pharmingen™ FITC Annexin V Apoptosis Detection Kit I [https://www.bdbiosciences.com/en-us/products/reagents/flow-cytometry-reagents/research-reagents/panels-multicolor-cocktails-ruo/fitc-annexin-v-apoptosis-detection-kit-i.556547]
- 45. BD Pharmingen™ FITC Annexin V [https://www.bdbiosciences.com/en-us/products/reagents/flow-cytometry-reagents/research-reagents/single-color-antibodies-ruo/fitc-annexin-v.556419]
- 46. Annexin V Staining Protocol [https://www.bdbiosciences.com/en-us/resources/protocols/annexin-v-staining-protocol]
- 47. Annexin V Staining Protocol for Flow Cytometry [https://www.thermofisher.com/us/en/home/references/protocols/cell-and-tissue-analysis/protocols/annexin-v-staining-flow-cytometry.html]
- 48. Annexin V and PI Staining for Apoptosis by Flow Cytometry [https://www.novusbio.com/support/apoptosis-flow-annexin-v-protocol?srsltid=AfmBOoqhQSwYEQoY72XNkLoBoYsBEXvTl-L2KBCZxFZOcOoV30j3GiGh]
- 49. Annexin V Staining | Thermo Fisher Scientific - US [https://www.thermofisher.com/us/en/home/life-science/cell-analysis/cell-viability-and-regulation/apoptosis/annexin-v-staining.html]
- 50. Annexin V PI Staining Guide for Apoptosis Detection [https://www.bosterbio.com/blog/post/methods/flow-cytometry-with-annexin-v-pi-staining?srsltid=AfmBOorhKFID_MZymzRiV1VnIMtEtrOhy22w1ZEyYtlMzIPBn6173L_F]
- 51. Measurement of the binding parameters of annexin ... [https://pmc.ncbi.nlm.nih.gov/articles/PMC2926222/]
- 52. Annexin V-FITC Early Apoptosis Detection Kit #6592 [https://www.cellsignal.com/products/cellular-assay-kits/annexin-v-fitc-early-apoptosis-detection-kit/6592?srsltid=AfmBOopceVaSGN2aegnB5E0qG7Gex6ilscWRHz2hUNGtqRm0jcKei3xj]
- 53. Annexin V-FITC/PI Apoptosis Kit [https://www.apexbt.com/annexin-v-fitc-apoptosis-kit.html]
- 54. Annexin V-FITC apoptosis detection kit [https://www.enzo.com/product/annexin-v-fitc-apoptosis-detection-kit/]
- 55. Designing a multicolor flow cytometry panel [https://www.abcam.co.jp/primary-antibodies/multicolor-flow-cytometry-panel-design]
- 56. How to Select the Appropriate Detection Channel Through ... [https://www.elabscience.com/resources/flow-cytometry-technical-topics/1070?srsltid=AfmBOorCOxl4gtT_TIUV9LmHI7fNTPA4pa07QHVzG8F43ZcVuJPt_Bw6]
- 57. Publishing flow cytometry data - PMC [https://pmc.ncbi.nlm.nih.gov/articles/PMC2822558/]
- 58. Annexin V-FITC Early Apoptosis Detection Kit [https://www.cellsignal.com/products/cellular-assay-kits/annexin-v-fitc-early-apoptosis-detection-kit/6592/datasheet?images=1&protocol=0&srsltid=AfmBOooZcCCvCwjppVIM6DyRpNILHIkjjrS_2C7BQM-FakJCrrRKFMdP]
- 59. A Guide to Spectral Flow Cytometry Fluorophore Selection [https://www.thermofisher.com/us/en/home/life-science/cell-analysis/flow-cytometry/flow-cytometry-learning-center/flow-cytometry-resource-library/flow-cytometry-methods/spectral-flow-cytometry-fluorophore-selection.html]
- 60. Annexin V-FITC Early Apoptosis Detection Kit #6592 [https://www.cellsignal.com/products/cellular-assay-kits/annexin-v-fitc-early-apoptosis-detection-kit/6592?srsltid=AfmBOoq7Qkky3ENWyMzUnGe_RVEErKAba0sCjE-aiCUXLlxHdymHW2e3]
- 61. Common Problems and Solutions in Annexin V-Based Flow ... [https://www.yeasenbio.com/blogs/cell/common-problems-and-solutions-in-annexin-v-based-flow-cytometry-apoptosis-assays]
- 62. My 3-step approach to gating Annexin V data appropriately [https://voices.uchicago.edu/ucflow/2012/07/08/my-3-step-approach-to-gating-annexin-v-data-appropriately/]
- 63. From proliferation to mitochondrial membrane potential ... [https://www.nature.com/articles/s41420-025-02391-2]
- 64. Annexin V Staining Protocol for Flow Cytometry [https://www.thermofisher.com/ng/en/home/references/protocols/cell-and-tissue-analysis/protocols/annexin-v-staining-flow-cytometry.html]
- 65. Use of intracellular pH and annexin-V flow cytometric ... [https://www.sciencedirect.com/science/article/abs/pii/S0022175998001665]
- 66. Inhibition of Cell Proliferation and Induction of Cell Cycle ... [https://pmc.ncbi.nlm.nih.gov/articles/PMC9843718/]
- 67. Shortwave-infrared (SWIR) emitting annexin V for high ... [https://pmc.ncbi.nlm.nih.gov/articles/PMC9257772/]
- 68. Precautions for Annexin V Apoptosis Assay [https://www.elabscience.com/resources/cell-function-guidelines-and-q-a/982?srsltid=AfmBOoriHo45UVK_MRHQySQJBeexTtQBeMLEVRVfoiJQiWSOD9tKkBpm]
- 69. Apoptosis assays with lymphoma cell lines [https://pmc.ncbi.nlm.nih.gov/articles/PMC2360094/]
- 70. Spontaneous apoptosis of cells in therapeutic stem ... [https://www.nature.com/articles/s41392-021-00688-z]
- 71. Annexin V-FITC Staining Protocol for Apoptosis Detection [https://www.creative-diagnostics.com/annexin-v-fitc-staining-protocol-for-apoptosis-detection.htm]
- 72. Analysis and Solution of Common Problems in Annexin V ... [https://www.elabscience.com/resources/cell-function-guidelines-and-q-a/981?srsltid=AfmBOop_CuKyJxUiDnzc2hz-bHNAAQMm1OEUgYI34JjznQFjMJ1kblfR]
- 73. Annexin V Staining Protocol [https://www.bdbiosciences.com/en-br/resources/protocols/annexin-v-staining-protocol]
- 74. Annexin V-FITC Early Apoptosis Detection Kit #6592 [https://www.cellsignal.com/products/cellular-assay-kits/annexin-v-fitc-early-apoptosis-detection-kit/6592?srsltid=AfmBOoq61OrycMW2a_J-vJwa23qqGVJly4RK1H8llZlR7otubIwQo3zL]
- 75. Annexin V-FITC Early Apoptosis Detection Kit #6592 [https://www.cellsignal.com/products/cellular-assay-kits/annexin-v-fitc-early-apoptosis-detection-kit/6592?srsltid=AfmBOooEp4no2qxZhL5CgKU-2wlgFn2CJ7T5J6vHmAHGLLNzWMVNrObN]
- 76. Impact of trypsin on cell cytoplasm during detachment of ... [https://www.sciencedirect.com/science/article/pii/S0006349524004065]
- 77. A mechanical model for lateral and axial impacts ... [https://www.nature.com/articles/s41598-025-02165-x]
- 78. Isolation, Extraction, and Analysis of Cells After Confined ... [https://pmc.ncbi.nlm.nih.gov/articles/PMC12452805/]
- 79. Choosing the right fluorophores for your experiment [https://www.abcam.com/en-us/technical-resources/guides/fluorescence-guide/choosing-the-right-fluorophores-for-your-experiment]
- 80. Antibodies 101: Designing Your First Flow Panel [https://blog.addgene.org/antibodies-101-designing-your-first-flow-panel]
- 81. Integrated real-time imaging of executioner caspase ... [https://www.nature.com/articles/s41420-025-02662-y]
- 82. Current trends in luminescence-based assessment of ... [https://pmc.ncbi.nlm.nih.gov/articles/PMC10613953/]
- 83. Annexin V PI Staining Guide for Apoptosis Detection [https://www.bosterbio.com/blog/post/methods/flow-cytometry-with-annexin-v-pi-staining?srsltid=AfmBOoqaZkF7LfqFBXJEzdrCYabGWM3CM5g9xGqNghv9_WAC00pd3v7X]
- 84. Robust high-throughput kinetic analysis of apoptosis with ... [https://pmc.ncbi.nlm.nih.gov/articles/PMC5261025/]
- 85. Annexin V Staining Protocol [https://www.bdbiosciences.com/en-eu/resources/protocols/annexin-v-staining-protocol]
- 86. of Early using a fluorescent conjugate of... detection apoptosis [https://pubmed.ncbi.nlm.nih.gov/9298227/]
- 87. TUNEL Assays | Thermo Fisher Scientific - US [https://www.thermofisher.com/us/en/home/life-science/cell-analysis/cell-viability-and-regulation/apoptosis/tunel-assays.html]
- 88. Detection of apoptosis by TUNEL assay [https://pubmed.ncbi.nlm.nih.gov/22566045/]
- 89. TUNEL staining [https://www.abcam.com/en-us/technical-resources/guides/cell-health-guide/tunel-staining-or-tunel-assay]
- 90. Detection of Apoptosis with Double Labeling: TUNEL and ... [https://www.rndsystems.com/resources/protocols/technical-notes-detection-apoptosis-double-labeling-tunel-and-active-caspase-3]
- 91. and Probes | AAT Bioquest Apoptosis Assays [https://www.aatbio.com/resources/application-notes/apoptosis-assays-and-probes]
- 92. Annexin V-FITC Apoptosis Assay Kit | 9124 [https://www.antibodiesinc.com/products/annexin-v-fitc-apoptosis-assay-kit-9124?srsltid=AfmBOoqENriv4U-MZ43D5U-wiY-EOLeqGpvbVReIlzMzm6UjAJlw0JOL]
- 93. Phosphatidylserine externalization during differentiation [https://www.nature.com/articles/4400484.pdf]
- 94. Phosphatidylserine externalization, “necroptotic bodies ... [https://journals.plos.org/plosbiology/article?id=10.1371/journal.pbio.2002711]
- 95. Analysing Caspase Activation and Caspase in Activity Cells Apoptotic [https://link.springer.com/protocol/10.1007/978-1-60327-017-5_1]
- 96. of Mechanisms activation and inhibition during caspase apoptosis [https://pubmed.ncbi.nlm.nih.gov/11931755/]
- 97. staining assay protocol for Annexin | Abcam V apoptosis [https://www.abcam.cn/technical-resources/protocols/annexin-v-for-apoptosis]
- 98. Annexin V-FITC Early Apoptosis Detection Kit #6592 [https://www.cellsignal.com/products/cellular-assay-kits/annexin-v-fitc-early-apoptosis-detection-kit/6592?srsltid=AfmBOorW6hBWE1l06Teyv3kOOK4NXce_7yk9N4x38OtpIx8ohvsHUMOv]
- 99. Guidelines for Regulated Cell Death Assays: A Systematic ... [https://www.frontiersin.org/journals/cell-and-developmental-biology/articles/10.3389/fcell.2021.634690/full]
- 100. Programmed cell death detection methods - PubMed Central [https://pmc.ncbi.nlm.nih.gov/articles/PMC9308588/]
- 101. Analysis of Apoptosis and Necroptosis by Fluorescence-Activated Cell... [https://pubmed.ncbi.nlm.nih.gov/27037070/]
- 102. JC-1 Dye for Mitochondrial Membrane Potential [https://www.thermofisher.com/us/en/home/life-science/cell-analysis/cell-viability-and-regulation/apoptosis/mitochondria-function/jc-1-dye-mitochondrial-membrane-potential.html]
- 103. Analysis of the Mitochondrial Membrane Potential Using ... [https://pmc.ncbi.nlm.nih.gov/articles/PMC6343665/]
- 104. Exposure of phosphatidylserine on the cell surface [https://www.nature.com/articles/cdd20167]
- 105. Phosphatidylserine exposure during apoptosis reflects ... [https://pmc.ncbi.nlm.nih.gov/articles/PMC3524639/]
- 106. JC-1: alternative excitation wavelengths facilitate ... [https://www.nature.com/articles/cddis2012171]
- 107. Phosphatidyl serine exposure during apoptosis precedes ... [https://www.sciencedirect.com/science/article/pii/S0014579399017020]
- 108. Annexin V CF® Dye Conjugates, Azide-Free, Lyophilized [https://biotium.com/product/cf-dye-annexin-v-conjugates-azide-free/]
- 109. Label-free Molecular Imaging and Analysis by Raman Spectroscopy - PMC [https://pmc.ncbi.nlm.nih.gov/articles/PMC6066646/]
- 110. Machine learning with label-free Raman microscopy to ... [https://www.nature.com/articles/s42003-025-07624-9]
- 111. In vivo detection of drug-induced apoptosis in tumors using ... [https://pmc.ncbi.nlm.nih.gov/articles/PMC6175619/]
- 112. Raman Scattering for Label-Free Chemical Imaging | Spectroscopy Online [https://www.spectroscopyonline.com/view/raman-scattering-for-label-free-chemical-imaging]
- 113. Evaluation of Label-Free Confocal Raman Microspectroscopy for Monitoring Oxidative Stress In Vitro in Live Human Cancer Cells [https://www.mdpi.com/2076-3921/11/3/573]
- 114. Spectral Markers for T Cell Death and Apoptosis—A Pilot ... [https://www.sciencedirect.com/science/article/pii/S0022354921004044]
- 115. Raman Spectroscopy as a Quantitative Tool for Industry [https://www.spectroscopyonline.com/view/raman-spectroscopy-quantitative-tool-industry]
- 116. Expression, purification and use of recombinant annexin V ... [https://www.nature.com/articles/nprot.2009.143]
- 117. Annexin V PI Staining Guide for Apoptosis Detection [https://www.bosterbio.com/blog/post/methods/flow-cytometry-with-annexin-v-pi-staining?srsltid=AfmBOopJzb1lgvKCYyHEwfrjiv-2m25K4QqGTJ2VOXm6yJmGGbEfS5WX]
- 118. Flipping the dogma – phosphatidylserine in non-apoptotic cell ... [https://pmc.ncbi.nlm.nih.gov/articles/PMC6819419/]